Version 4 Documentation Overview
- Welcome to Flying Logic
- A brief overview of why you'll love Flying Logic.
- Flying Logic Resources
- Links to all the corners of the Internet where Flying Logic hangs out.
- Recommended Reading
- Great books and web sites we can't say enough good things about.
- Flying Logic User Guide
- How to use the software.
- Flying Logic Scripting Guide
- How to automate actions in Flying Logic using its built-in Python interpreter.
- Thinking with Flying Logic
- The thinking tools you need to use Flying Logic to its best advantage.
Welcome to Flying Logic 4
A brief overview of why you'll love Flying Logic.
Colophon
© 2025 Arciem LLC
Flying Logic® is a Registered Trademark of Arciem LLC

This work is licensed under a Creative Commons Attribution-NonCommercial-ShareAlike 4.0 International License.
The Elevator Pitch
Flying Logic is a revolutionary tool for proactive thinkers, whether you want to change your personal life for the better, or grow a world-class business that impacts thousands or millions of people. Flying Logic is a highly visual, easy to use software application that does for reasoning what spreadsheets do for numbers. Just as you would not do detailed financial projections in your head, you need Flying Logic for all nontrivial planning and reasoning endeavors. Project management software won’t help you when you have no idea what part of a complex system needs improvement, or what that improvement might look like, or how to cause that improvement. Answering these questions is a critical and often-overlooked part of the planning process, and this is where Flying Logic shines. Flying Logic diagrams are not static images— they are working models of your reasoning that you test as you build and that stay “live” as you share your reasoning with others.
Critical Thought More Critical Than Ever
Rational thinking, planning, and communication skills are key to every field of human endeavor ranging from personal growth to building viable, competitive businesses. Even the ability to successfully articulate non-rational concepts such as emotion and intuition ultimately depends upon the mind’s power to reason. And anyone from young children, to governments, to the CEOs of multinational corporations can benefit from well-developed reasoning abilities and a common language in which to reason. Flying Logic is a revolutionary tool that fills a widespread need for software that supports, simply and beautifully, the practice of reasoning. However, no software can do your thinking for you, so Flying Logic was inspired by the Theory of Constraints.
The Theory of Constraints (TOC)
The Theory of Constraints is an overall management philosophy founded on the idea that all real-world systems; whether personal, interpersonal, or organizational; have at least one constraint: something that holds the system back from accomplishing more of its primary purpose, or goal. The rate of this accomplishment is called throughput. If a system had absolutely no constraints, it would be capable of infinite throughput. But though infinite throughput is impossible, amazing throughput gains are possible through the careful identification and management of the system’s key constraints. The purpose of the TOC, originally developed by Eliyahu M. (“Eli”) Goldratt and first popularized in his bestselling business novel The Goal, is to give individuals and organizations the tools they need to manage their constraints in the most effective manner possible. Originally applied to manufacturing lines, TOC principles have been successfully adapted for areas as diverse as supply chain, accounting and finance, project management, health care, military planning, and software engineering.
TOC claims that a real-world system with more than three constraints is extremely unlikely, and in fact usually only one constraint is key. Perhaps counter-intuitively, this is because the more complex a system becomes, the more interrelationships are necessary among its parts, which results in fewer overall degrees of freedom.
A major implication of this is that managing a complex system or organization can be made both simpler and more effective by providing managers with few, specific, yet highly influential areas on which to focus — maximizing performance in the areas of key constraints, or elevating the constraint (making it less constraining.)
The Five Focusing Steps
To accomplish this, the developers of TOC developed the Five Focusing Steps, which define a process of ongoing improvement. (Step Zero was later added for additional clarity.)
0. Articulate the goal of the system. How do we measure the system’s success?
1. Identify the constraint. What is the resource limiting the system from attaining more of its goal?
2. Exploit the constraint to its fullest. How can we keep the constraining resource as busy as possible, exclusively on what it does best?
3. Subordinate all other processes to the decisions made in Step 2. How can we align all processes so they give the constraining resource everything it needs?
4. Elevate the constraint. If managing the constraining resource more efficiently does not give us all the improvement we need, then how can we acquire more of the resource?
5. Avoid inertia. Has the constraint moved to some other resource as a result of the previous steps? If so, don’t allow inertia itself to become the constraint: go back to step 1.
The Thinking Processes (TP)
The Thinking Processes emerged as TOC practitioners worked with organizations that needed to identify their core constraints and how to manage or elevate them. They needed the answers to three deceptively simple questions:
- What to change?
- To what to change?
- How to cause the change?
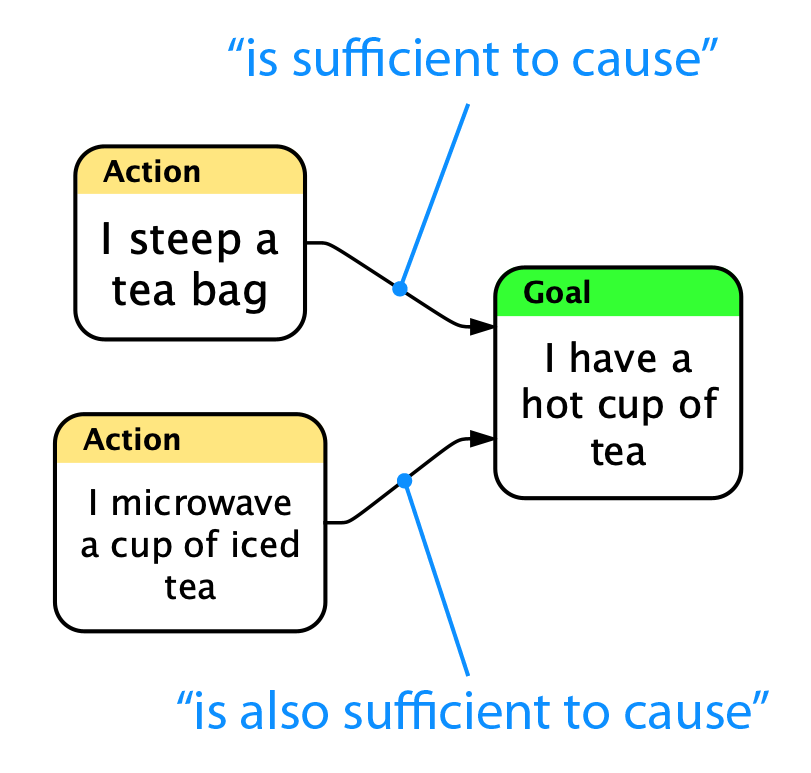
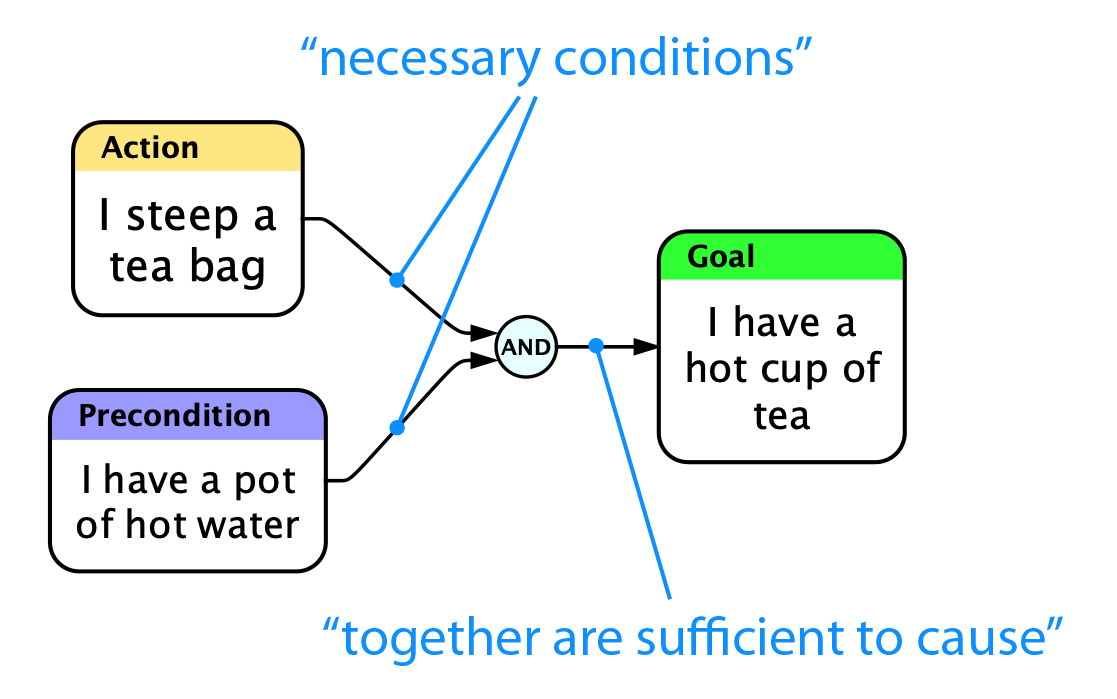
The Thinking Processes are based on the scientific method, to which is added a simple visual language for describing and reasoning about situations, arguments, and plans using the language of cause and effect. There are two basic kinds of reasoning: sufficient cause and necessary condition.
.png)
.png)
From these, the practitioners developed several methodologies called application tools designed to answer the three questions. The application tools provide the ability to develop a complete picture of a system’s core constraints and how to overcome them.
Current Reality Tree
Used to move from an articulation of the undesirable symptoms (or desirable strengths) present in a system to the core cause that has the most influence over them (i.e., the constraining resource or core issue.)
.png)
Evaporating Cloud (Conflict Resolution Diagram)
Used to move from apparently mutually-exclusive options to creative, win-win solutions by surfacing and “breaking” the assumptions that underlie the supposed conflict.
.png)
Future Reality Tree
Used to move from a sketched-out plan to a fully-realized plan by thoroughly examining the consequences of various proposed actions applied to the current reality.
.png)
One of the principles that distinguishes the TOC-TP is its emphasis on seeking and blocking the undesirable effects of actions (UDEs.) This is an essential activity when constructing Future Reality Trees and Transition Trees.
.png)
Transition Tree
Used to move from a set of predetermined goals to a set of actions that both achieve the goals and that deliberately avoid or mitigate undesirable effects.
.png)
Prerequisite Tree
Used to move from a set of objectives and attendant obstacles that stand in the way of accomplishing each objective, to a set of feasible intermediate objectives (milestones) that when fully implemented overcome every obstacle and thus achieve every objective.
.png)
Strategy and Tactics Tree
The latest addition to the TOC-TP application tools, the Strategy and Tactics Tree is used to move from the highest-level organizational goals to a comprehensive, multi-tiered, fully-justified set of implementation steps.
.png)
The Need for Software Support
Although there are many success stories of organizations that have implemented TOC using the Thinking Processes, so far there have been two problematic approaches to working with the application tools:
• Groups work with a facilitator in front of a white board to capture their thinking. This has the drawback that as they grow, whiteboard diagrams quickly become disorganized and difficult to understand.
• Individuals create their own plans or memorialize plans created by other groups using tools such as Visio™. The primary drawback to this approach is that the planner often becomes bogged down in diagram layout details: fonts, sizes, colors, placement, styles, etc., that have nothing to do with the actual planning process.
• Either way, there is no easy way to test the logic inherent in the diagram.
Flying Logic was designed to eliminate all of these constraints by allowing groups or individual planners to create Thinking Process diagrams using an intuitive interface that requires no attention to layout issues, and by producing presentation-quality output as a by-product of the planning process.
By providing a clear, visual language of causes and effects, Flying Logic encourages detached, rational thinking. By removing constraints around re-working the diagram, Flying Logic encourages people to painlessly consider every factor that really matters, and address every blind spot as it comes up. A good analogy is spreadsheet software— before spreadsheets, people still did financial projections, but they were laborious, error-prone, and there was a great deal of resistance to rework. After spreadsheets, people take many more factors into consideration and easily explore many more alternatives in their financial planning.
Just as a spreadsheet allows you to play “What if...?” with numbers, Flying Logic lets you play “What if...?” with plans, arguments, and ideas.
The Flying Logic Interface
Flying Logic uses a simple, gesture-based interface. Drag from the list of entity types on the left to create your diagram. Each time you place an entity, it “snaps into place” with arrows that represent the causal relationships automatically appearing where you want them. Drag from entity to entity to create additional causal relationships as desired, or drag from entity to arrow to combine causes into necessary condition relationships. Relationships representing AND, OR, and NOT are easily created.
.png)
.png)
A Working Model
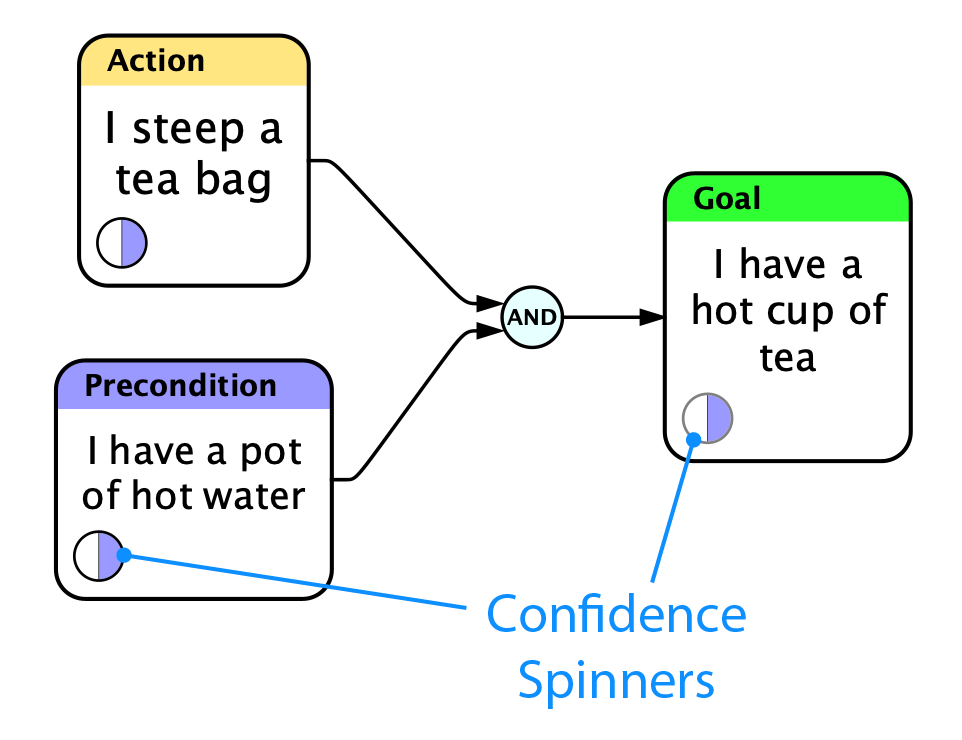
As you build your diagram, or when it is time to present it to others, you can step through the actual model of your logic by using the confidence spinners attached to the entities. As each spinner is adjusted, the other affected spinners move in tandem.
.png)
The various operators you use in the diagram determine how the data flowing through it is combined along the way.
If you need sophisticated operations beyond AND, OR, and NOT, Flying Logic supports many advanced operators:
.png)
Annotations, Groups
Every diagram element can be annotated using textual annotations which appear in the diagram as yellow bullets. In the TOC-TP methodology, annotating the causal relationships is particularly important, as they explain why you believe that one or more causes are sufficient to produce particular effects. Multi-level grouping of entities is also supported, and groups can be collapsed to help manage even very complex diagrams. Groups can also be given titles and annotated.
.png)
Free Your Mind to Focus On Your Problem
As you create your diagram, Flying Logic takes full responsibility for the layout of the entities and relationships that connect them. Because the sophisticated graph layout engine built into Flying Logic makes many decisions about how to keep the diagram compact, the number of line crossings minimal, etc., Flying Logic displays smooth, animated transitions each time the diagram is modified. The animations preserve your “mental map” of the diagram even though Flying Logic may sometimes completely reorganize the layout. This technology frees you to concern yourself entirely with what the diagram means.
Professional-Quality Output
Flying Logic outputs print-quality PDF files, as well as JPEG and PNG files suitable for use in presentation software. Flying Logic Pro can also export diagrams to Microsoft Project™ when you are ready to move to traditional project management techniques.
Visit FlyingLogic.com for demos, purchasing information, and more!
📖 Flying Logic Resources
Flying Logic Documentation
This web site! Your home for all of Flying Logic's online documentation.
FlyingLogic.com
Your Headquarters for all things Flying Logic.
Flying Logic Academy
Learn everything you need to know with our self-paced courses!
Discussion Forum
Our main user forum containing examples, templates, feature requests, and longer-form discussion threads.
Discord Sever
Live chat between Flying Logic staff and our users. Best for quick, ephemeral topics.
YouTube Channel
Tutorial videos with lively training and tips.
𝕏 (formerly Twitter)
Flying Logic-related announcements and news.
Beware of Wolf Podcast
Wolf McNally's podcast. Fearless explorations of timeless values like critical thinking, personal development and sensemaking that have never been more critical.
Recommended Reading
Books
Get the most from Flying Logic! For detailed information on the Theory of Constraints and its Thinking Processes, we recommend these books. Click the links to order now on Amazon.com:
• Thinking for a Change: Putting the TOC Thinking Processes to Use by Lisa J. Scheinkopf.
• The Logical Thinking Process: A Systems Approach to Complex Problem Solving by H. William Dettmer.
Web Sites
Some excellent third-party web sites that will help you think better:
- Farnam Street Helping you master the best of what other people have already figured out.
- Untools A collection of thinking tools and frameworks to help you solve problems, make decisions and understand systems.
- Your Fallacy Is... Learn to identify and call out dodgy logic wherever it may raise its ugly, incoherent head.
- TOCICO: Theory of Constraints International Certification Organization A primary source of knowledge and pathway to become a real TOC practitioner with member resources and certification recognized worldwide.
Flying Logic 4 User Guide
Colophon
© 2025 Arciem LLC
Flying Logic® is a Registered Trademark of Arciem LLC
Version 4.0
This work is licensed under a Creative Commons Attribution-NonCommercial-ShareAlike 4.0 International License.
Getting Started
Quick Start Video
Make sure you watch this essential video on getting started with Flying Logic, and subscribe to the Flying Logic YouTube channel for new videos.
System Requirements
Windows
- Windows 11, Windows 10, Windows 8
- 200MB free disk space
MacOS
- Intel-based Mac running OS X 10.14 or later
- Apple silicon-based Mac running MacOS 11 or later
- 240MB free disk space
Linux
- Linux 5.0 or later
- 200MB free disk space
Linux Compatibility
Flying Logic should be compatible with most Linux distributions that have a full-featured window manager.
Installation
- Windows: Run the installer provided.
- MacOS: Drag the application to your Applications Folder.
- Linux: Run the install script provided.
What's New
This edition of the User's Guide covers Flying Logic version 4.0 and later.
New Major Features Since Release of Flying Logic 4.0
These features are marked by release version; e.g., ; in this list and where it may be documented more fully. For the full list of changes including bug fixes, see Version History on the main Flying Logic web site.
-
Connect Distant Elements: Connect selected elements to an unselected element by ALT-Left-Click (Option-Left-Click on Mac)
-
Zoom-up Entity or Edge Annotation: When the graph is zoomed-out, you can zoom-up an entity or edge annotation when the cursor over it and pressing ‘Z’.
-
Export to Realization Concerto: Export to Realization Concerto for seamless critical chain project management.
-
Enhanced Text Cut and Paste: Styled text can be cut and pasted between annotations and other applications.
-
Enhanced MS Project Import: MS Project import now supports .MPP files.
New Features in Flying Logic 4.0
These features are marked .
- Auto-Recovery: When Flying Logic is exited with documents still open, they are automatically saved and restored again when the application is next launched. This includes when the user chooses the Quit command, and the rare occasions when the application exits unexpectedly due to a bug or system failure.
Auto-Recovery is not a substitute for regularly saving and backing up your work: you are responsible for making sure you avoid unintended data loss.
- Multi-Line Entity Titles: Entity titles can now explicitly have multiple lines. To start a new line type ALT-Enter (Option-Enter on Mac).
- Fine-grained selection operations in the Edit menu: Select Path Between, Select All Successors, Select All Predecessors, Select Successors and Select Predecessors.
- Quick drag to create entity: Create a new successor or predecessor entity by a new simple drag gesture starting from any existing entity.
- Colors Domain: A new "Colors" domain has replaced the old "General" domain. Flying Logic 3 docs loaded into Flying Logic 4 have any entities with Generic and Note entity classes are converted to White and Yellow classes, respectively.
- Enhanced Find: The Find command will now successfully locates text in titles and annotations with multiple lines.
- More Ways to Select Neighbors: The previous "Select Successors/Predecessors" commands have been renamed "Select All Successors/Predecessors" and the new "Select Successor/Predecessor" commands select only the very next successor (or predecessor) of the selected elements. This allows you to highlight flow paths incrementally.
- Find the path between two selected entities: The Select Paths Between Entities command will find all the ways it's possible to traverse from the first selected entity to the second.
- New Default Classes: The "Effects-Based Planning" domain contains two new entity classes: Critical Success Factor and Necessary Condition, which are particularly useful for Goal Trees.
- Retina Icons: All the icons in the app have been given a refresh and appear in high resolution on retina displays.
- Manage Your Subscription Details: The new Help ➡ Edit Your Profile command opens a web page that lets you update your contact and billing information.
Subscribing
Get up and running with a subscription.
To use Flying Logic beyond its trial period, you can either
- Use Reader Mode to open, explore, print, or export documents
- Become a Flying Logic subscriber!
Subscription Benefits
- All updates to Flying Logic as long as your subscription remains current
- Access to the Flying Logic Basics course in the Flying Logic academy at no additional charge.
- More benefits coming soon!
How to Subscribe and Activate the Software
Individuals or Teams
You can subscribe by:
- Clicking the Purchase Now button in the "Welcome to Flying Logic" dialog at startup,
- Clicking on the Purchase button in the bottom-left of the document window,
- Selecting the Help > License Status command and then clicking the Purchase button,
- Visiting flyinglogic.com/purchase.
When you have your registered email and password, click the "Login" button in the Welcome to Flying Logic dialog. Your web browser will open for authentication, and then you will be redirected back to the app.
.png)
Enterprises
When you receive your Organization Name and Registration Key, click the "Enterprise customers with an Organization Name and Registration Key Click Here" link in the "Welcome to Flying Logic" dialog to enter the registration information.
.png)
Reader Mode
Everyone in your team or organization can benefit from Flying Logic— even without a subscription!
You Don't Need a Subscription to Open and Read Flying Logic Documents
Once Flying Logic's free trial period expires, to continue using all its features you must either:
- For individuals and teams, become a subscriber and enter a subscriber e-mail and password, or
- For enterprises, enter an organization name and registration key.
However, if you only want to open, read, and explore Flying Logic documents sent to you by others, or open documents you created in the past without a subscription, you can simply let the trial period expire, and then Flying Logic will be in Reader Mode.
In Reader Mode you can open Flying Logic documents, scroll through them, change display modes, collapse and uncollapse groups, and change confidence spinners and even export or print the document. But any attempts to actually modify or save the document will be met with a friendly reminder to purchase a license for the whole product.
If you have any difficulty in activating your subscription, please email us at support@flyinglogic.com and we'll help out!
The Document Window
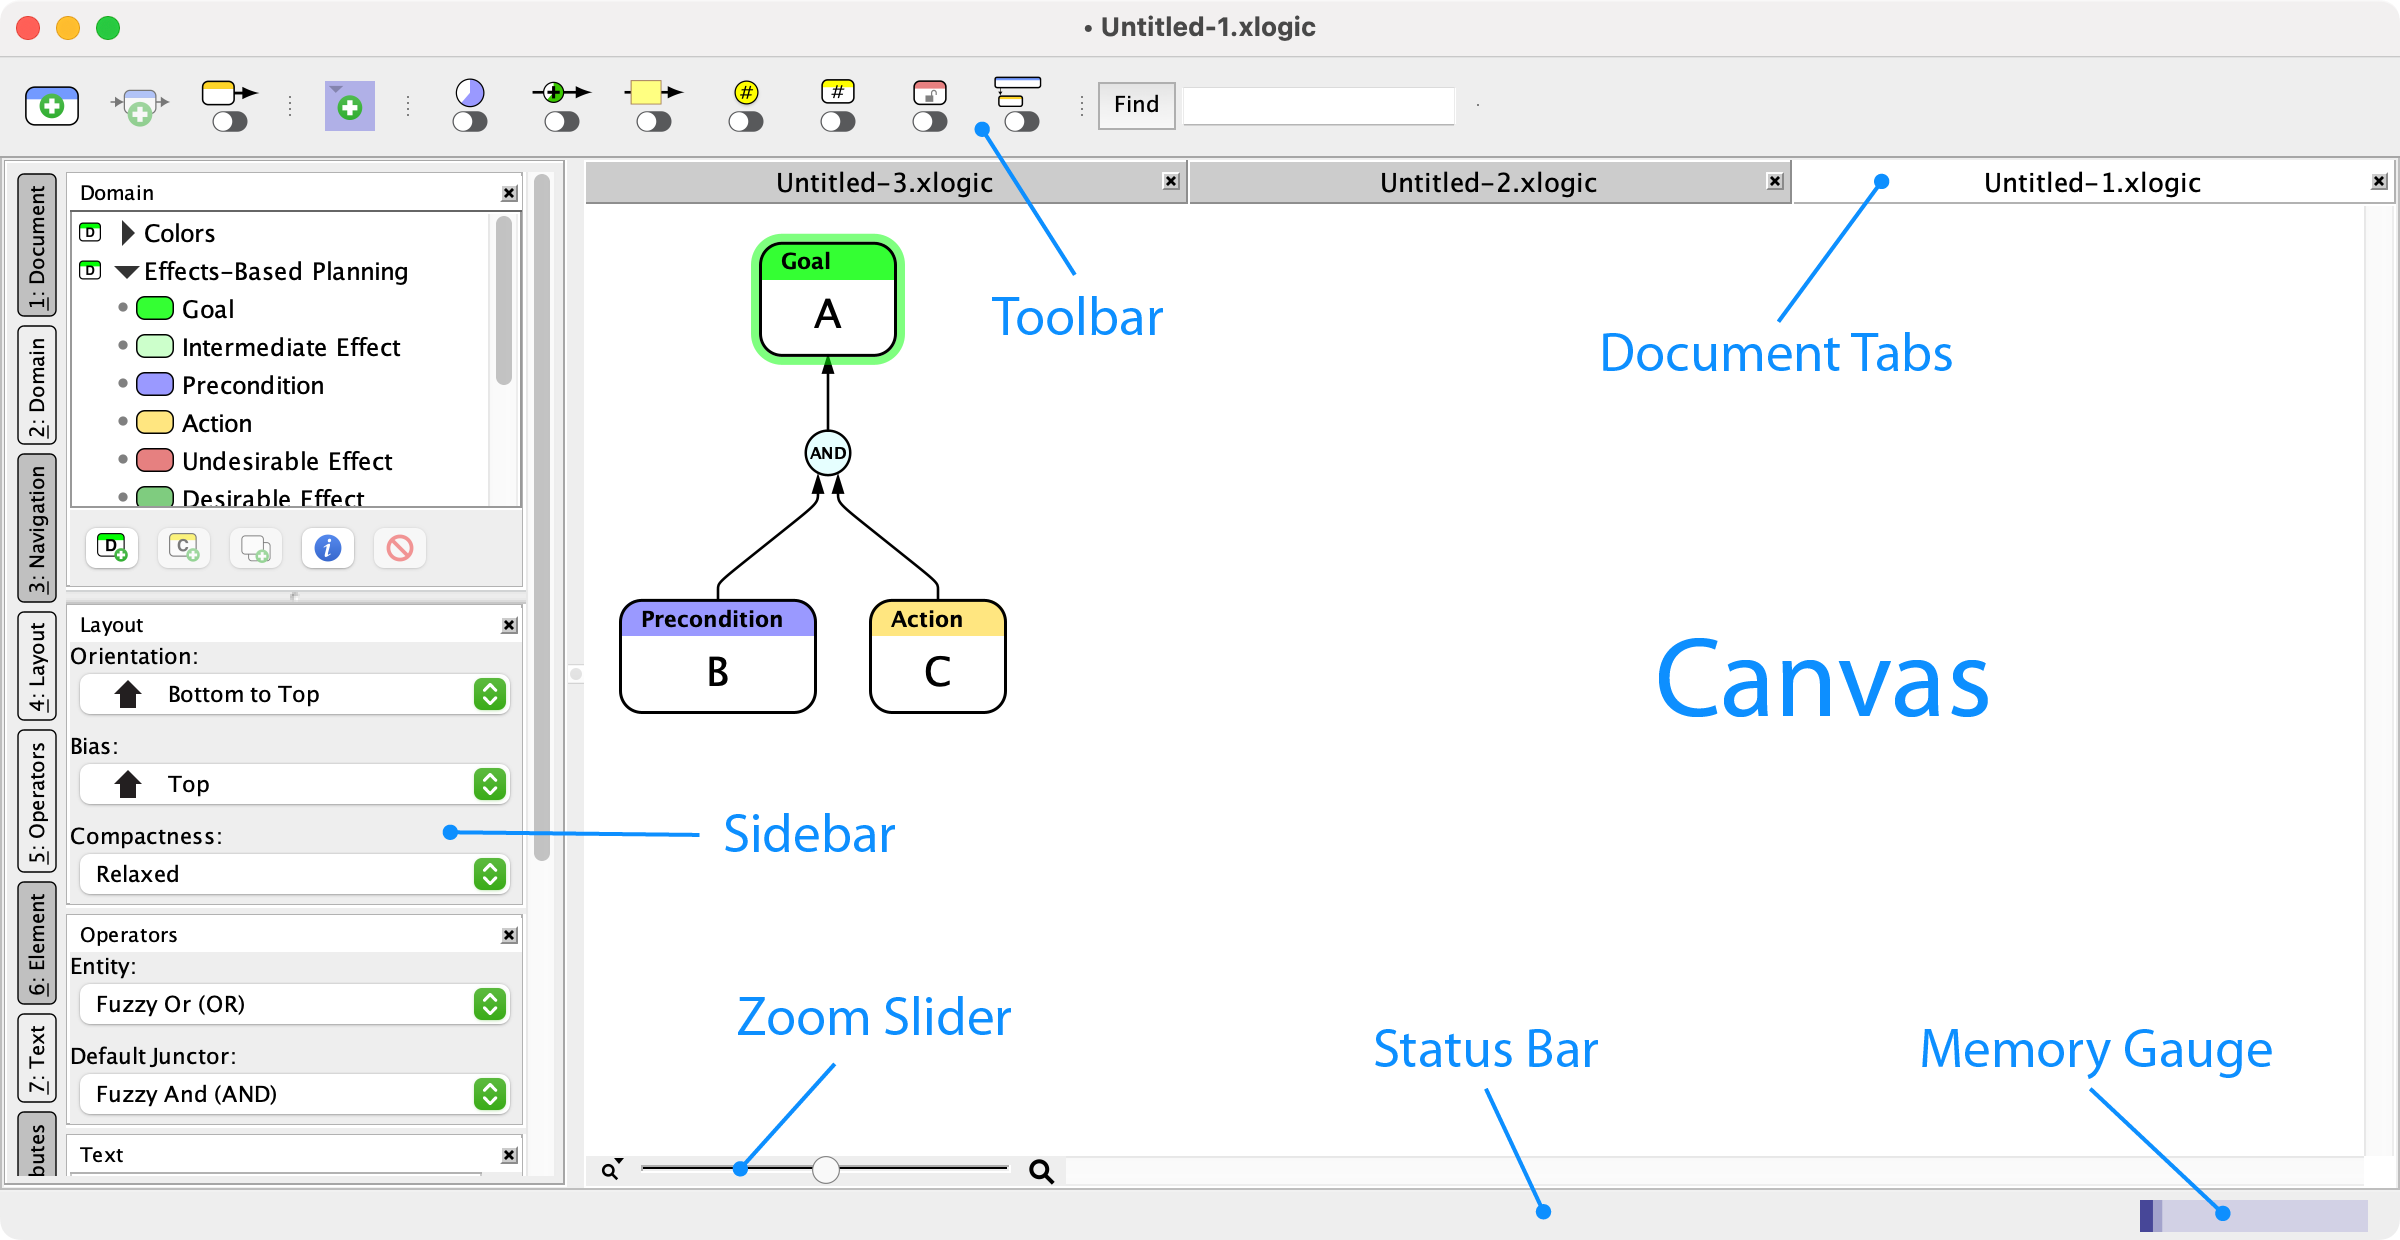
Flying Logic can have multiple documents open at one time. Each document window is divided into several functional parts.
The Canvas
The Canvas is where you do most of the work of building your diagram. See Constructing Graphs for information on working with the Canvas.
If the diagram in the canvas is too big to fit into the window, there are several ways to move your view around:
- Use the scroll bars that become active at the bottom and right sides of the Canvas.
- Click and drag in the blank gray background of the Canvas. This gesture is called “sliding,” and causes the view to continuously scroll in the direction of the gray gesture arrow. The scrolling speed is proportional to the distance you drag from the place where you initially click.

- Click in the Canvas, then hold down the Control key and press (or press and hold) an arrow key to slide the view.
- Use your mouse scroll wheel to move your view.
- Use the Navigation Inspector to easily change the part of the document you are viewing. See Navigation Inspector for details.
In addition to moving your view around, you can also zoom your view in or out.
- Use the Zoom Slider at the bottom of the canvas or in the Navigation Inspector to shrink the graph down to 25% of its normal size so more is visible, or enlarge it up to 400% of its normal size for use in presentations.
- Click the magnifier icon on either side of the zoom slider to display a popup menu that lets you select a specific zoom level.
- Use the View ➡ Zoom to Fit and View ➡ Full Size commands.
- Hold down the Alt key and use your mouse scroll wheel to zoom in or out.
- Press < or > to zoom in or out, respectively.
When the view is zoomed out, it may be difficult to read the text in an entity or edge annotation. To assist in viewing these elements without changing the zoom level, you can move the mouse cursor over the element and press "Z". This will magnify that one element for easier viewing.
The Toolbar

The toolbar contains a row of icon buttons that are used to perform common tasks. Each button has a tooltip that appears when you move the cursor over it to remind you of its function. From left to right the icons in the toolbar represent Add Entity, Insert Entity, Add Entity as Successor, Open Quick Capture, Add Group, Show/Hide Confidence Values, Show/Hide Edge Weights, Show/Hide All Edge Annotations, Show/Hide Annotation Numbers, Show/Hide Entity IDs, Turn On/Off Incremental Layout, and Turn On/Off Project Management. The Toolbar also contains a live search field and a Find button that provides a search dialog.
Document Tabs
When more than one document is loaded in a window, a Document Tab bar will appear just below the Toolbar. The tab of the current document appears with a bright background color, while other tabs have a dark background color.
To switch documents, click the document’s tab. You can close a document in a tab by clicking the close box button at the right side of the tab. You can reorder the tabs by dragging a tab along the bar.
If there are too many documents loaded in a window to show all the tabs, a pop-up menu will appear at the far right of the bar. You can select a document from this menu to make its tab appear in the bar. This will move the document represented by the former rightmost tab to the pop-up menu.
The Sidebar and Inspectors
The Sidebar contains eight collapsible inspectors. Each inspector gives you control over a specific aspect of your Flying Logic document. Click the vertical buttons or press Command (Mac) or Control (Windows) and the corresponding numeral to show or hide the corresponding inspector.
Document Inspector
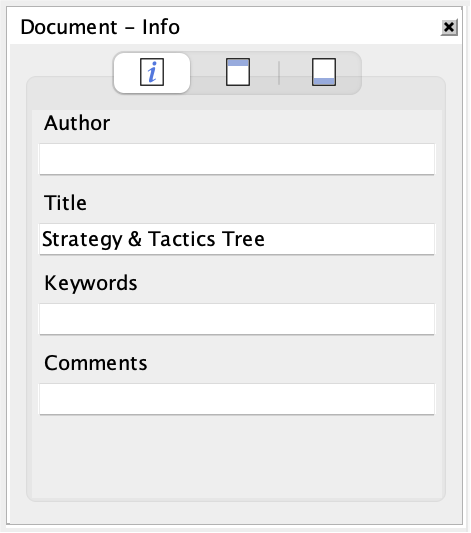
The Document Inspector contains three tabs: Info, Header, and Footer. The Info tab lets you specify metadata for your document, while the Header and Footer tabs allow you to specify which metadata should appear at the top and/or bottom of each printed page.
Domain Inspector
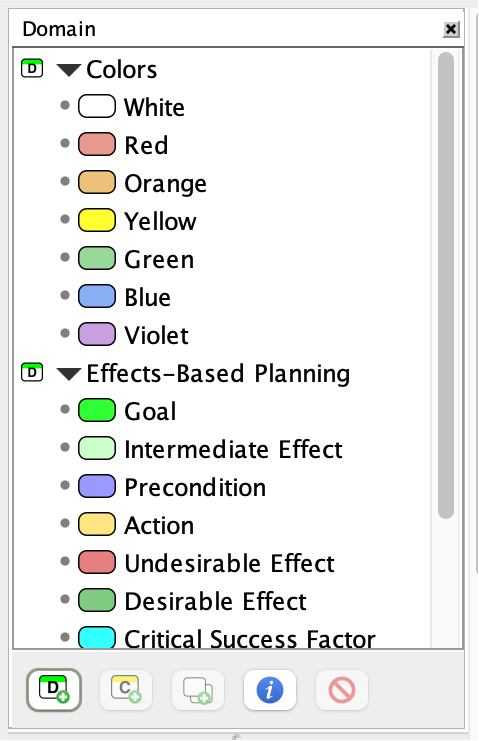
The Domain Inspector lists the kinds of entities (“entity classes” or just “classes”) you can put into your diagram. There are five predefined groups (“domains”) of classes: the General domain includes two classes: Generic and Note, and the other four include several additional classes each. Which entity classes you use will depend on the needs of your project. For information on using the Domain Inspector to construct your diagram, see Constructing Graphs. For information on creating your own custom classes, see Domains.
The Generic and Note built-in classes have their “Show Name” attribute turned off. Therefore, they will be displayed without the name of their class at the top of the entity rectangle, and will have an all-white (or all-yellow) background. You can create your own custom classes that either show or hide the class name. See Creating A Custom Class.
Navigation Inspector
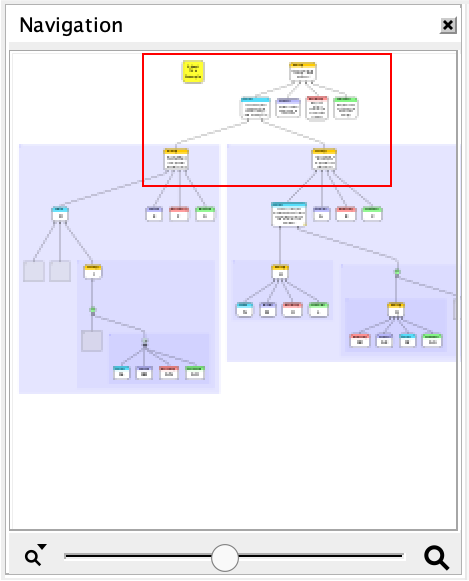
The Navigation Inspector contains a thumbnail view of your entire document and a red rectangle that represents the section of the document currently visible in the Canvas. You can click and drag within the thumbnail to move the view, and use the inspector’s Zoom Slider to make the view larger or smaller.
Layout Inspector
.png)
Flying Logic documents all “flow” from their beginning to their end in the direction of the arrows (“edges”) that connect the boxes (“entities”), and the Orientation popup in the Layout Inspector lets you determine the direction of this flow. The Bias popup lets you determine whether Flying Logic’s automatic layout prefers to push entities towards the beginning or end of the document’s flow. The Compactness popup will change the length of the edges to give different levels of compactness to the graph. For more information, see Layout.
Operators Inspector
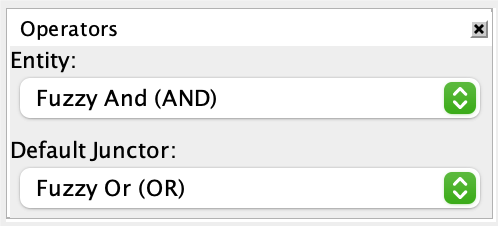
The Operators Inspector lets you set the operators associated with incoming edges for the entities in your document, and the operator associated with newly-created junctors. For more information, see Operators.
Element Inspector
The Element inspector contains four tabs, one for each kind of element in Flying Logic documents: Entities, Edges, Junctors, and Groups. The controls in each tab of the inspector let you adjust various attributes of the currently selected elements of that kind.
Entity Tab
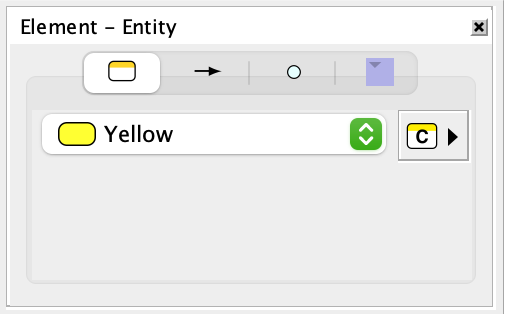
The Class Popup is used to quickly assign a new class to the currently selected entity or entities. For more information, see Changing the Class of an Entity. Each entity can have a symbol assigned to it to make it easier to identify. Symbols are assigned to entities using the Entity tab of the Element Inspector. For more information, see Assigning Symbols to Entities.
Edge Tab
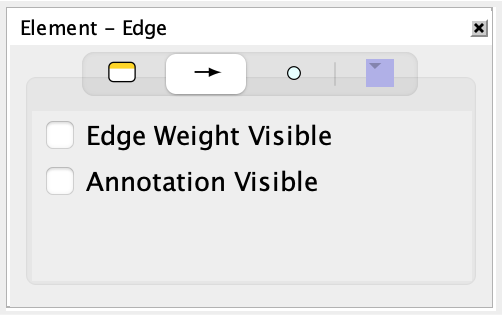
Edges can display their edge weight, their annotation, or both, and these attributes can be set for all currently selected edges from the Edge Tab. For more information, see Edge Weights and Text Inspector.
Junctor Tab
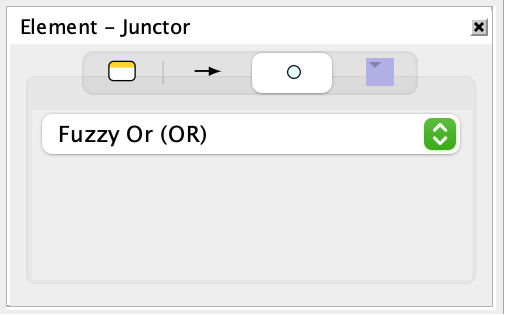
The operator associated with the currently selected junctors can be set from the Junctor Tab. For more information, see Working With Junctors and Operators.
Group Tab
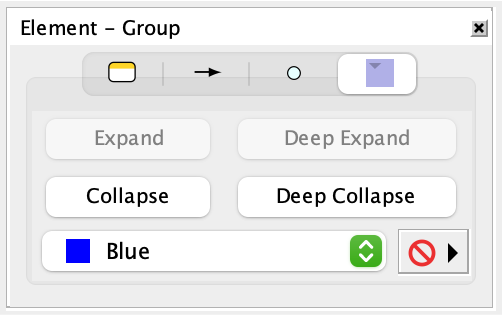
The currently selected groups can be expanded or collapsed, and their color can be set, from the Group Tab. Groups can also have a custom icon. For more information, see Working With Groups.
Text Inspector
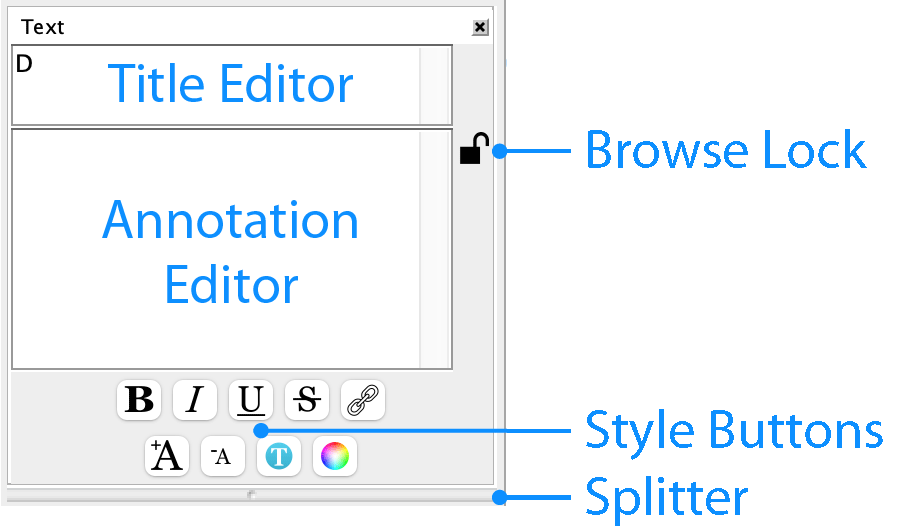
The Text Inspector provides several tools for editing the text in titles and annotations for the currently selected element.
Annotations
The Title Editor displays (and can also be used to edit) the title of the currently selected entity or group. See Constructing Graphs for more information about editing titles.
Every element (entity, edge, junctor, group) in the diagram can have its own annotations, and these are created and edited in the Annotation Editor. Annotations can be any length and are intended to be where detailed supporting information and underlying assumptions are recorded. Use the splitter to change the size of the Annotation Editor. To create an annotation or edit an existing one, select the element you wish to annotate, then click in the annotations area. If an element has an annotation, it will appear in the diagram with a small yellow circle on it.
Edge annotations can also be displayed as separate boxes with visible text. To display annotation boxes for every edge in the diagram, select the View ➡ Edge Annotations command, or click the Show/Hide All Edge Annotations button in the toolbar. To display edge annotations for only selected edges, select the edges then right-click (Mac, control-click) on any of them and select Show Selected Edge Annotations from the contextual menu. When an edge annotation is visible, you can edit it directly by either double-clicking it, or by selecting the edge and pressing the Tab key.
.png)
Without Annotations
.png)
With Annotations
.png)
Visible Edge Annotations
The setting for the View ➡ Edge Annotations command overrides the settings for showing individual edge annotations. When it is turned on, all edge annotations will be visible and the individual settings for edges are ignored.
Creating annotations for edges is particularly important, as the edges “hide” your assumptions about why you believe one entity causes (or contributes to the cause of) another. Surfacing these assumptions is a critical aspect of using the Thinking Processes.
Styled Text, Hyperlinks, and Browse Lock
Annotations can contain styled text and hyperlinks (clickable URLs). These are both editable and viewable in the Annotations Editor of the Text Inspector.
The Browse Lock button to the right of the Annotation Editor is used to switch between editing mode (unlocked) and browsing mode (locked). In browsing mode, hyperlinks are clickable and open the linked-to page in your web browser. In editing mode, they are directly editable.
Styled text attributes can be changed for the currently selected text by using the commands in the Format ➡ Font menu.
The text that represents a hyperlink and the underlying URL can be separately edited by placing the insertion point within a link then using the Format ➡ Edit Hyperlink command.
Styled annotations are also editable and hyperlinks are clickable in visible edge annotations. Clicking or editing a hyperlink in a visible edge annotation behaves according to the state of the Browse Lock button in the Annotation Editor.
The hyperlink text can take several forms:
-
A URL reference to a web page:
http://sciral.com/products/index.html -
A reference to another Flying Logic document in the same directory as the current document:
My Document.xlogic -
A reference to an entity by Entity ID in another document:
My Document.xlogic#42 -
A reference to an entity by Entity ID in the current document:
#42
In URL terminology, the text of a URL following the (“#”) mark is called the “fragment”. In addition to Entity ID, Flying Logic now supports a number of additional fragment specifiers.
-
A more explicit reference to an Entity ID:
#entityid=42 -
The exact, case-sensitive text of an entity’s title:
#title=This is the Text of the Title -
The exact, case-sensitive text of an entity’s annotation:
#note=This is the text of the note. #annotation=This is the text of the note. -
All entities of the named class:
#class=Goal -
The exact, case-sensitive text matching either the name or value of user-defined attributes:
#attrname=Price
#attrvalue=49.99
#attrname=Price #attrvalue=49.99 -
The exact, case-sensitive text matching the name or abbreviation of a resource:
#resource=Alice -
All elements matching the Find string:
#find=The text to find -
Options for the Find function. These correspond to the checkboxes in the Find dialog. More than one option can be specified by separating the options with a comma. The options
entityid,attrname, andattrvalueare new to this release.#options=(and|regex|casesensitive|titles|notes|annotations|entityid|attrname|attrvalue|incollapse|wholewords)
More than one fragment specifier may be used by separating them with ampersands (“&”). For example:
#find=water&find=tea&options=titles
Will find every entity with the word “water” OR the word “tea” in its title, while:
#find=water&find=tea&options=titles,and
Will find every entity with the word “water” AND the word “tea” in its title.
User-Defined Attributes Inspector
The User-Defined Attributes Inspector supports adding custom, user-defined attributes to document elements and on the document itself. Each attribute is a name-value pair, and the values can be defined as being String, Integer, Real (floating-point), or Boolean (true or false).
With nothing selected in the document, the User-Defined Attributes Inspector is used to edit the document attributes:
.png)
User-Defined Attributes Inspector, no selection
With any other selection, the User-Defined Attributes Inspector is used to add, edit, or remove the attributes from all selected elements simultaneously:
.png)
User-Defined Attributes Inspector, elements selected
User-defined attributes can simply be used as a more structured form of annotation. However, in conjunction with Flying Logic’s scripting system, they can also be used as data in scripted operations, or help improve the export and import of documents. For more information, see the section on Scripting and the Flying Logic Scripting Guide.
Constructing Graphs
Flying Logic diagrams are technically known as graphs.
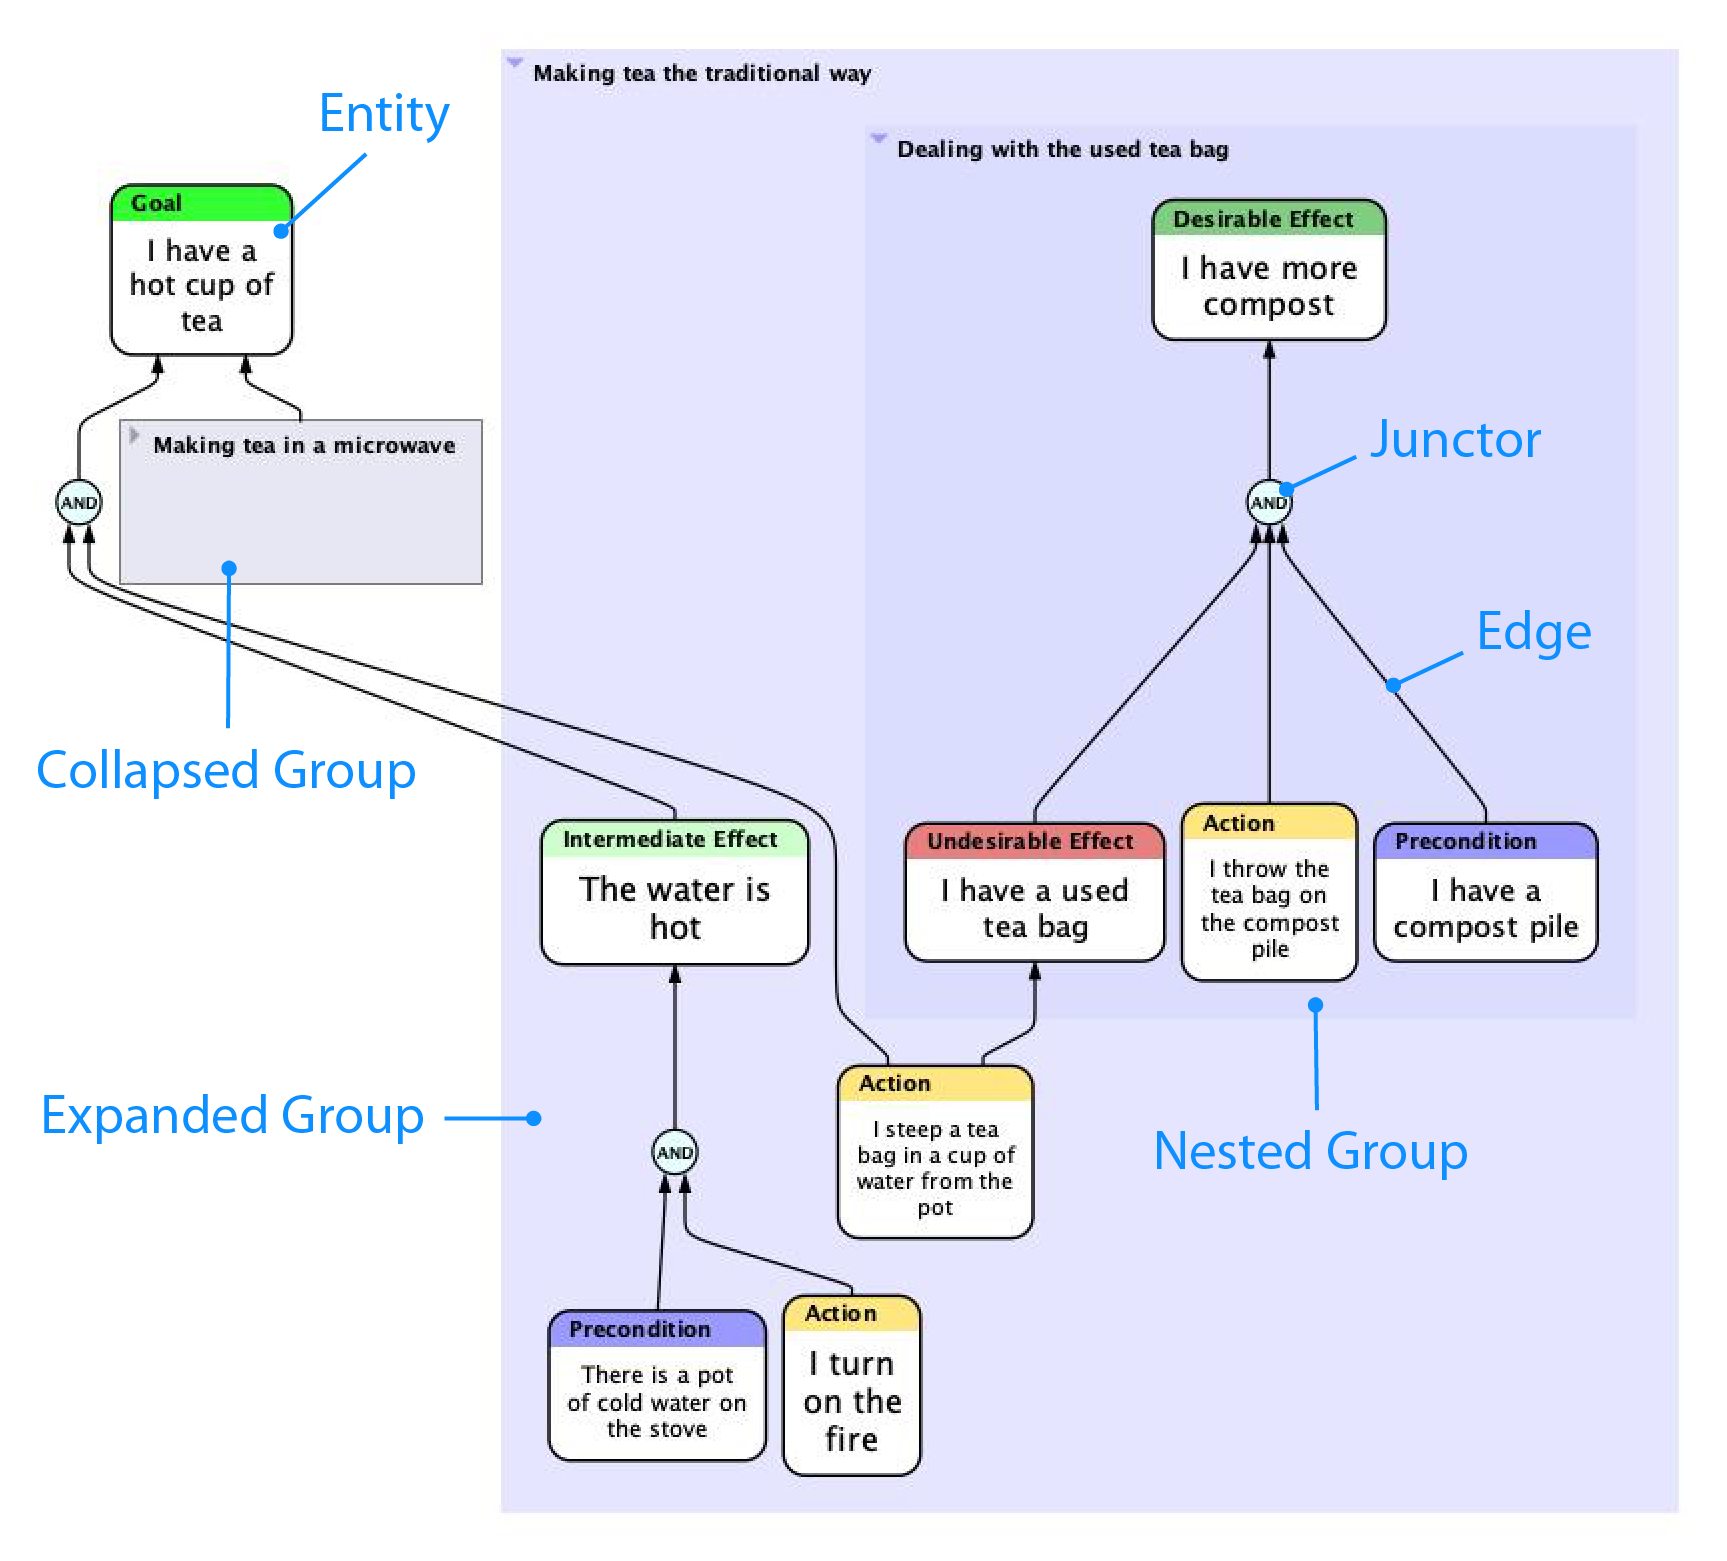
Flying Logic diagrams are technically known as graphs. A graph is a set of vertices (also called points or nodes) linked by a set of edges (also called lines or arrows.) Graphs can generally be used to represent many things, from street maps to social networks. In Flying Logic, graphs are often used to represent a network of causes and effects called entities and the causal relationships between them. The graph can also include junctors, which help you control the way the causal relationships combine, and groups, which help you organize your documents and manage larger documents.
Video: The Four Elements of Flying Logic
Working With Entities
Entities represent the causes and effects in your diagram. Each entity has a title, which is a short descriptive phrase, and can also include a much longer annotation. Entities also have a class, which is a word or two that describes what kind of entity it is, and that appears in a colored bar at the top of the entity. For a description of the classes built into Flying Logic, see Thinking with Flying Logic.
There are several different ways to create new entities within your document. Once you learn them, developing complex diagrams quickly will feel quite natural.
Add Entity as Successor
In the toolbar and Entity menu is the Add Entity as Successor switch:
.png)
The behavior of several commands and gestures used to add entities to the diagram depends on how this switch is set, and usually you will set it once depending on what sort of diagram you are building. You can also toggle the switch from the keyboard by pressing Command-Shift-E (Mac) or Ctrl-Shift-E (Windows or Linux).
The commands that use this switch either add a new entity pre-connected to an existing one...
...Or they first insert a junctor along the edge, then connect a new entity to it:

In the descriptions that follow, the  icon is read “predecessor or successor,” and appears whenever the setting of the Add Entity as Successor switch is observed.
Creating Entities With Menu Commands
- Select a class from the Domain Inspector, then select the Entity ➡ New Entity command or click the New Entity button in the toolbar. If an open group is also selected in the diagram, the new entity will be added to that group. If an entity or junctor is selected in the diagram, the new entity will be created as a (predecessor or successor depending on the switch) of the selected entity or junctor. If an edge is selected in the diagram, a new junctor will be inserted along the edge, and the new entity will be made a of the new junctor.
- Select a class from the Domain Inspector and also select an edge in the diagram, then select the EntityInsert Entity command or click the Insert Entity button in the toolbar. A new entity will be inserted along the selected edge.
- Right-click (Mac, Windows, Linux) or Control-click (Mac) on the gray diagram background or an open group, and select an entity class from the popup menu. A new, unconnected entity will be added to the clicked group or the top level of the document.
- Right-click (Mac, Windows, Linux) or Control-click (Mac) on an existing entity, edge, or junctor; then select an entity class from New Entity in the popup menu. If an edge was clicked, a junctor will be inserted along the edge, and the new entity will be added as a of the new junctor.
Creating Entities With Drag and Drop
- Drag a class from the Domain Inspector, and drop it either on an open group, or on the gray background of the Canvas. A new, unconnected entity will be added to the target group, or the top level of the document.
- Drag a class from the Domain Inspector, and drop it on an existing entity or junctor. The new entity will be created as a of the target entity or junctor.
- Drag a class from the Domain Inspector, and drop it directly on an existing edge. A new junctor will be inserted along the edge, and the new entity will be made a of the new junctor.
Creating Entities With Drop Zones
Flying Logic also has special DropZones that allow you to easily place new entities in precise relationships to existing diagram elements without needing to use the Add Entity as Successor switch. With a little practice, DropZones will become your favorite way to construct Flying Logic diagrams.
DropZones are near each edge, but not on the edge, and highlight when you move the cursor over them while dragging a class from the Domain Inspector.
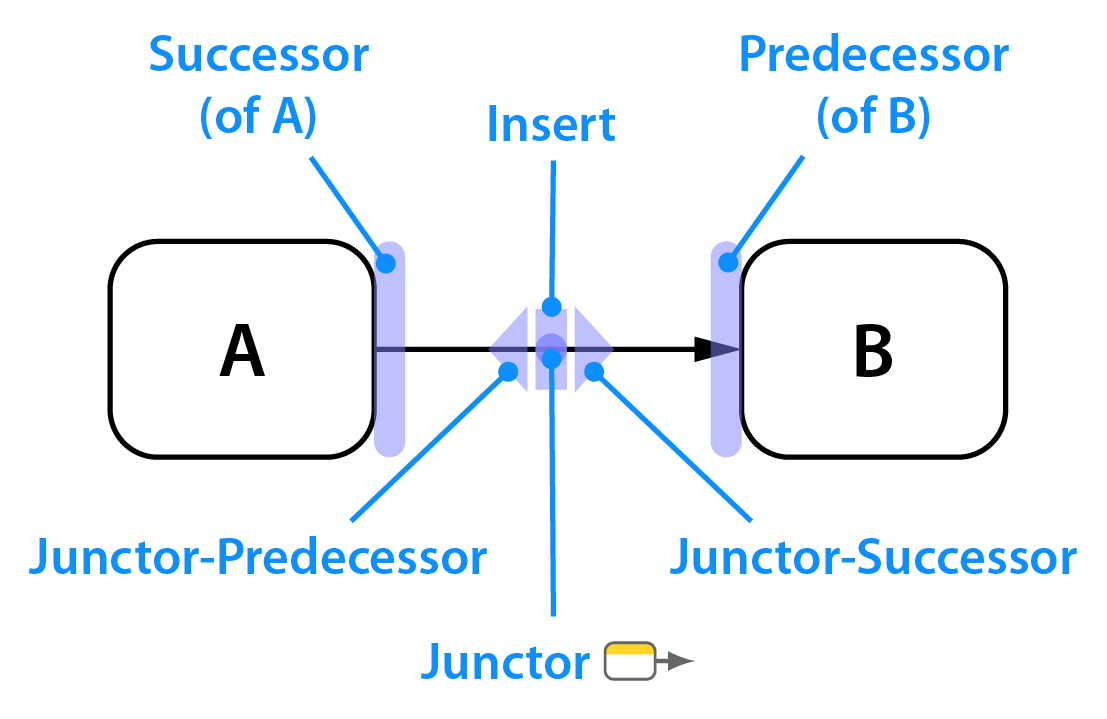
The position of the DropZones depends on the setting of the diagram orientation popup in the sidebar. In the examples below, the orientation is set to Bottom to Top. In this case, the Predecessor DropZone is underneath entities or junctors. If the orientation were set to Left to Right, as in the diagram above, then the predecessor DropZone would be to the left of entities or junctors.
- Drag a class from the Domain Inspector to the Predecessor DropZone of an existing entity or junctor:
- Drag a class from the Domain Inspector to the Successor DropZone of an existing entity or junctor:
- Drag a class from the Domain Inspector to the Junctor-Predecessor DropZone of an edge:
- Drag a class from the Domain Inspector to the Junctor-Successor DropZone of an edge:
- Drag a class from the Domain Inspector to the Insert DropZone of an edge:
Creating Entities Quickly
Flying Logic includes two ways to quickly create many entities: Quick Capture and the New Entities from List on Clipboard command.
Quick Capture
The Open Quick Capture button in the Toolbar allows you to create numerous entities quickly by simply typing their titles and pressing Enter. This is particularly useful when you are brainstorming with a group, and need to get a lot of ideas down quickly.
Quick Capture can be activated any time by pressing the E key, and can be exited by pressing Escape.
New Entities from List on Clipboard
If you copy lines of text to the clipboard, you can quickly turn them into entities by selecting the Entity ➡ New Entities from List on Clipboard command. This command creates the entities in the currently selected group, and assigns them the entity class currently selected in the Domain Inspector. It also intelligently detects line prefixes like bullets or other symbols and removes them.

Changing the Class of an Entity
To change the class of all selected entities, use one of the following options:
- Right-click (Mac, Windows, Linux) or Control-click (Mac) on the entity and select the desired class from the popup menu.
- Select a new class in the Class Popup of the Entity Tab of the Element Inspector.
- Option double-click (Mac) or Alt-double-click (Windows) on the desired class in the Domain Inspector.
Editing Entity Titles and Annotations
Double-click the entity to begin editing its title, or with an entity selected, press the Tab key. An editor appears over the entity that lets you type or modify the entity title. When you are done editing, press Enter/Return or click outside the editor to commit your changes. If the Text Inspector is visible, you can press Tab again to commit your changes and begin editing the entity’s annotation. Finally, you can press Escape to discard your changes.
You can directly edit an entity’s annotation by selecting the entity, then clicking in the Annotation Editor of the Text Inspector. When you are done editing, commit the change by clicking in the background of the Canvas. To remove an annotation, select and delete all the annotation text.
Annotation Numbers and Entity IDs
Flying Logic uses two different numbering systems that you can make visible in each document.
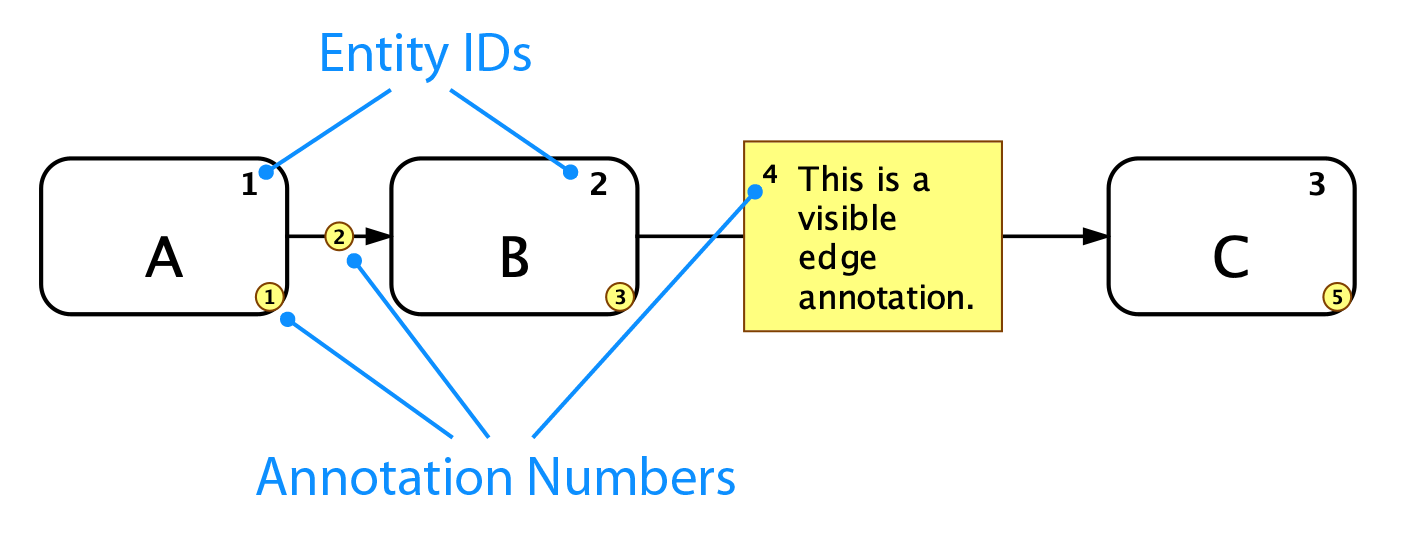
Annotation Numbers are revealed by clicking the Annotation Numbers icon in the Toolbar or by selecting View ➡ Annotation Numbers. Annotation numbers are primarily used for matching textual annotations (or their small yellow bullets) in the Canvas to the corresponding full text of the annotations exported using the File ➡ Export Annotations as PDF or File ➡ Export Annotations as Text commands. Unlike Entity IDs, annotation numbers are ephemeral and are renumbered every time the document is changed, which keeps the annotation numbers in the same order they appear along the flow of the document. This means that if you export notes from a Flying Logic document, then make changes to your document, you will need to re-export the notes for the exported numbers to match.
Entity IDs are revealed by clicking the Entity IDs icon in the Toolbar or by selecting View ➡ Entity IDs. Unlike Annotation Numbers, Entity IDs are durable and continue to exist throughout the life of the entity, unless the entities in the document are explicitly renumbered by using the Entity ➡ Renumber Entity IDs command.
Element Text Attributes
The View ➡ Element Text Attributes, dialog allows you to refine the way Flying Logic displays text throughout your document. The dialog contains three tabs for adjusting the attributes of entities, groups, and annotations. Each tab contains an area where you can preview the changes you make.
Entity Text Attributes
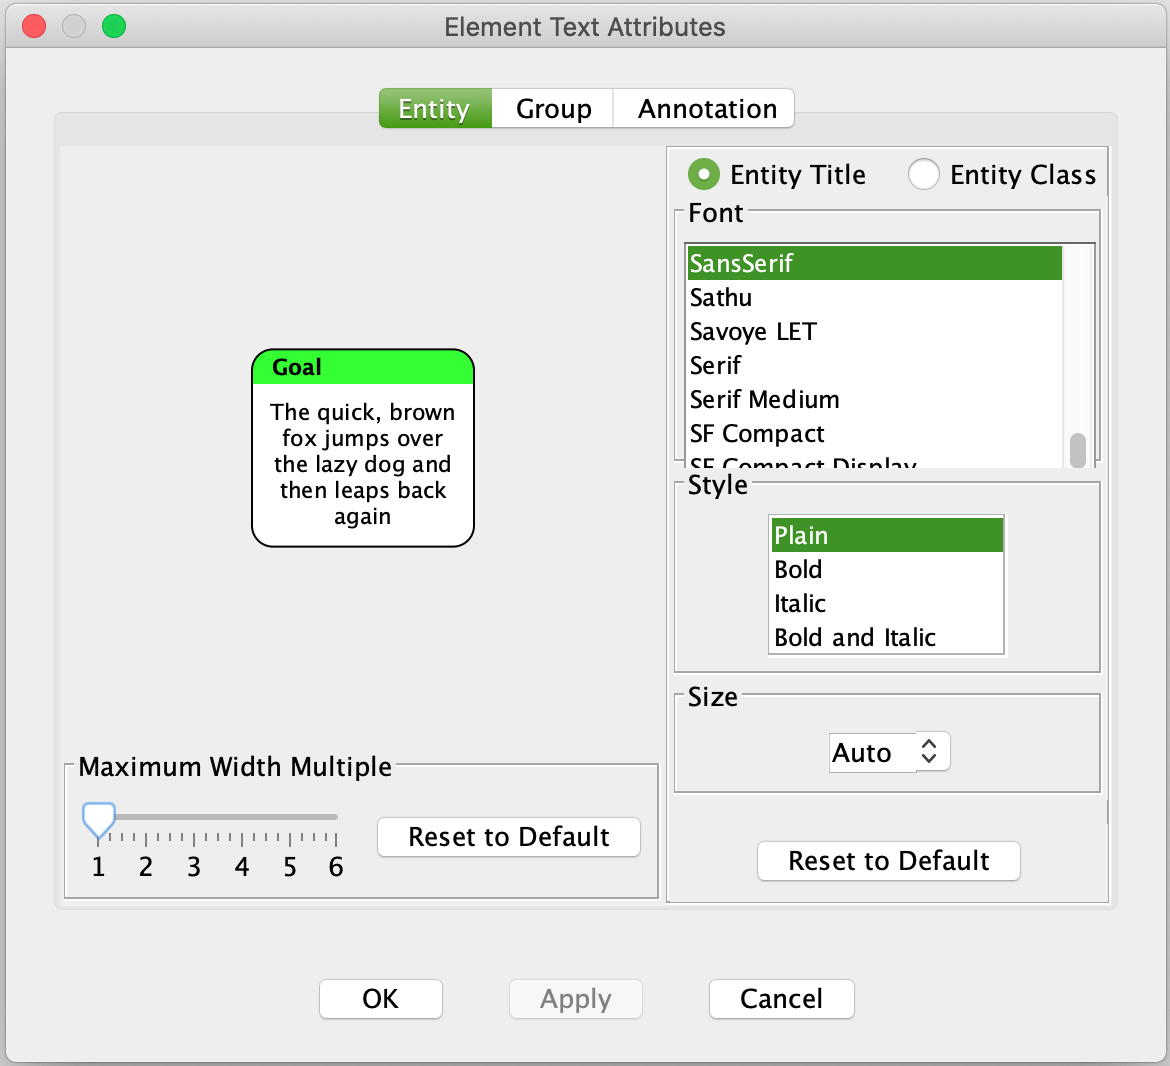
The two radio buttons in this tab let you choose between modifying the attributes of the entity title (the text in the white part of the entity) and the entity class (the text in the colored band at the top of the entity.)
When Font Size is set to “Auto”, Flying Logic selects a font size for entity titles based on the amount of text in the title:

By selecting a particular Font Size, you tell Flying Logic to use a fixed-size font for all entity titles:

Flying Logic normally chooses a fairly narrow width for containing entity titles, but this can cause long titles to be laid out taller than you might prefer. You can use the Maximum Width Multiple slider to ask Flying Logic to choose a width for long entity titles.

Clicking the Reset to Default button restores the default attributes for the tab.
Group Text Attributes
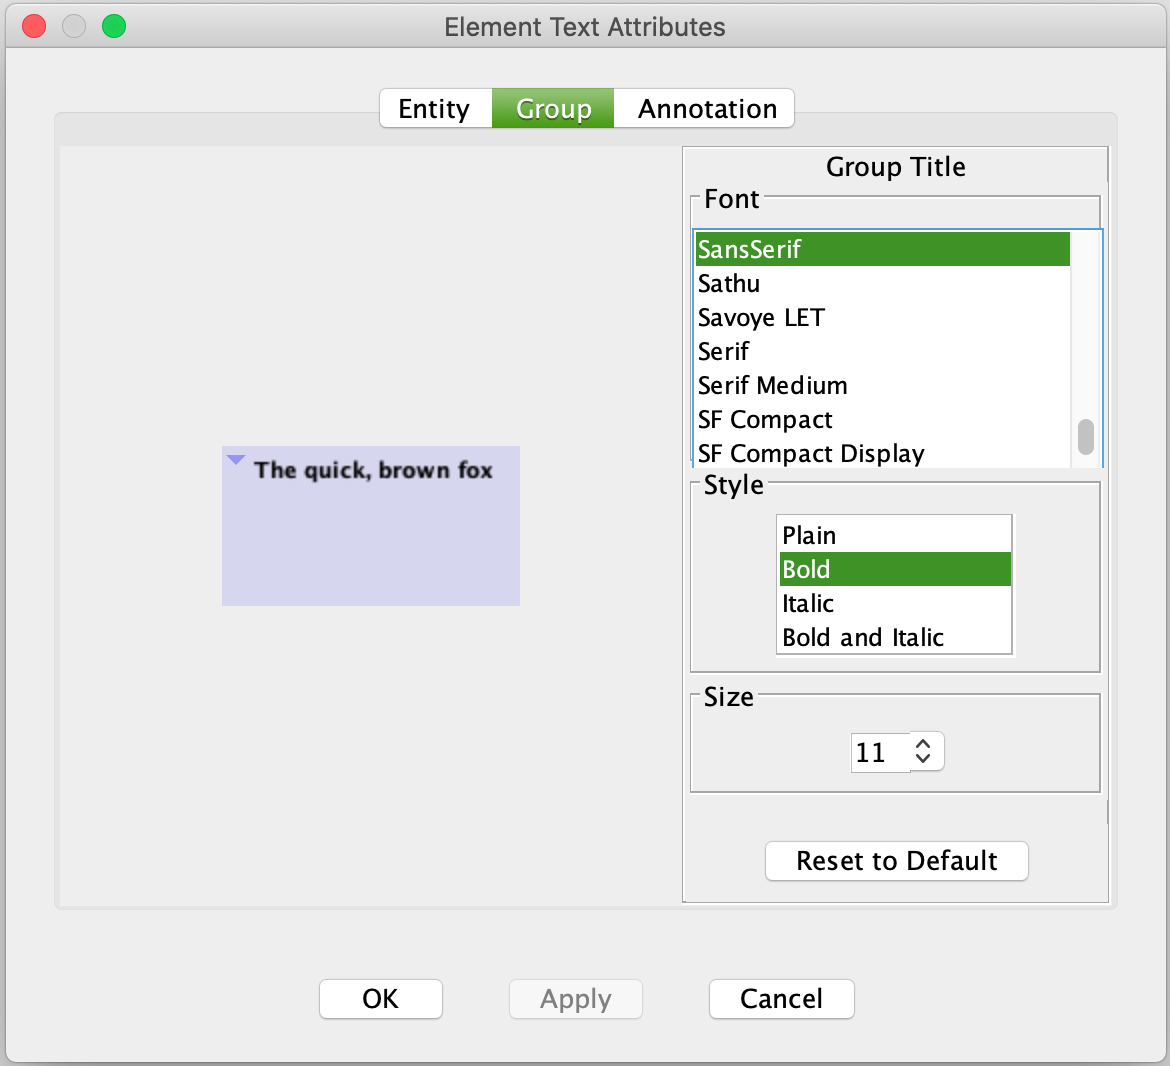
This tab lets you choose the attributes that are used to display group titles.
Annotation Text Attributes
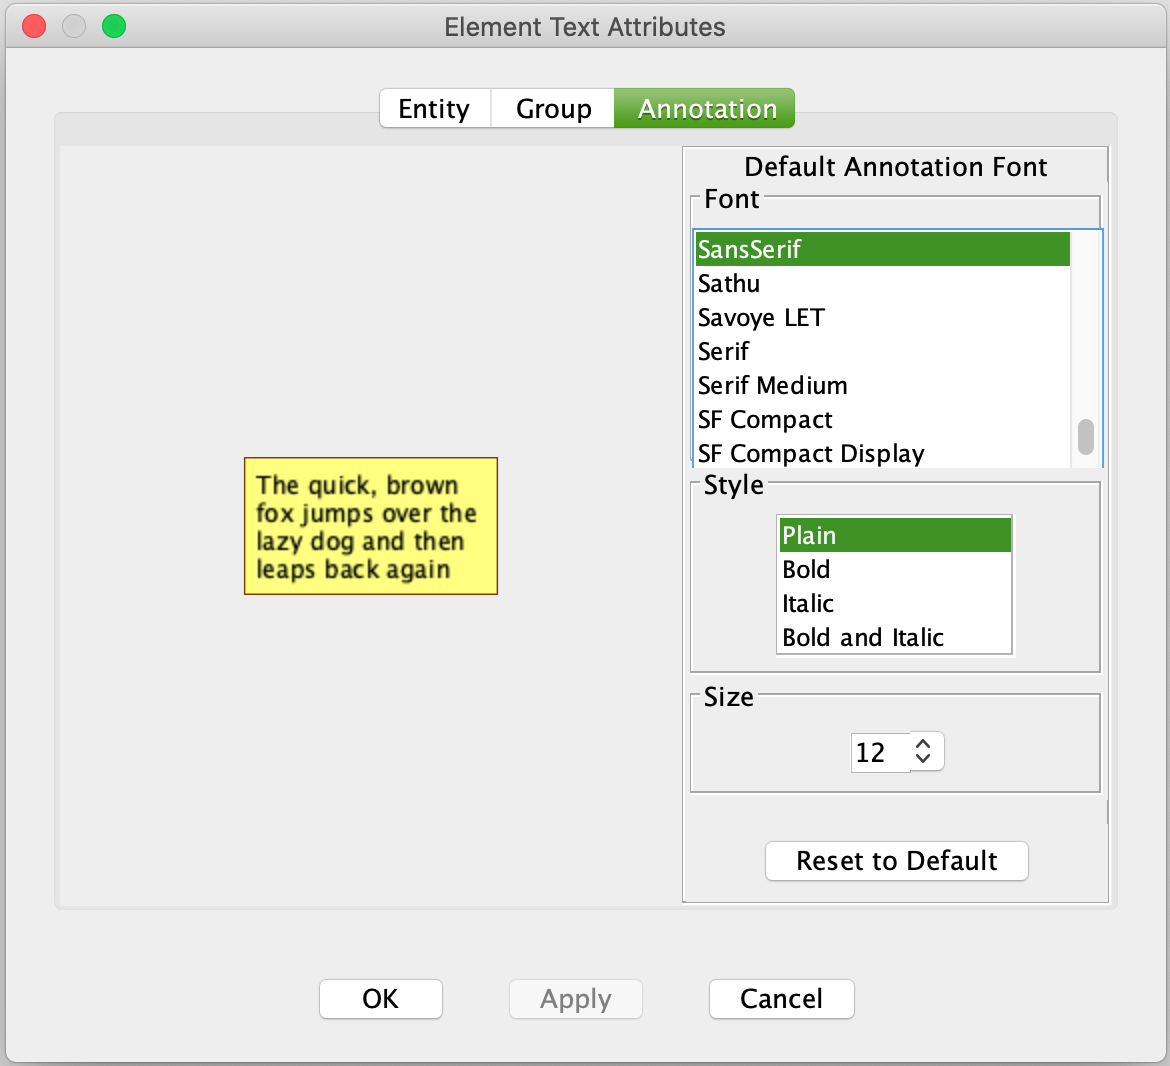
This tab lets you choose the default attributes that are used to display annotation text. As annotation text supports styles, this is the style that will be used in the absence of overriding styles.
Assigning Symbols to Entities
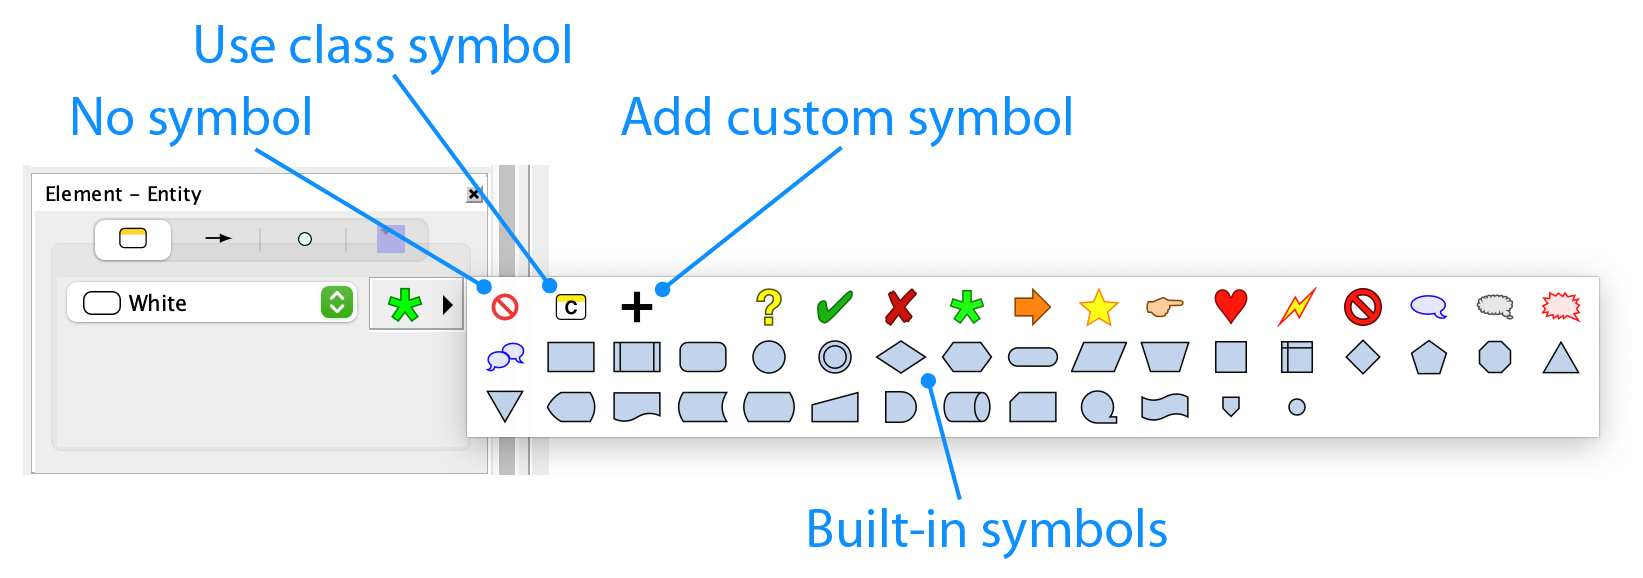
To assign a symbol, select one or more entities, then select the desired symbol from the Icon Popup in the Entity tab of the Element Inspector. To remove a symbol, select the 🚫 icon in the upper-left corner of the popup.

Assigning Symbols to Classes
Symbols can also be automatically assigned to an entire entity class. For instructions on how to do this, see Creating A Custom Class. Whenever entities of such a class are created, the symbol will automatically apply to them, but can still be overridden on an entity-by-entity basis. To revert to the default symbol for a class, select the ![]() icon in the upper-left corner of the popup.
icon in the upper-left corner of the popup.
Adding Custom Symbols
In addition to the built-in symbols, you can add your own custom symbols from graphics files in SVG, PNG, GIF, or JPEG formats. Custom symbols are saved inside the Flying Logic document, so you can be sure that anyone to whom you send a Flying Logic document will be able to see your custom symbols without having a copy of the original image file.
- Click the + icon in the symbol popup menu.
- From the file chooser dialog that appears, select a SVG, PNG, GIF, or JPEG (JPG) document.
- A dialog appears that lets you select a part of your image to use as the symbol. Adjust the cropping rectangle and click the Accept button.
- Your custom symbol(s) appear at the end of the built-in symbols list in the symbol popup, and you can then assign them to entities (or classes) the same way you use the built-in symbols.
Small, simple images look best, and SVG (Scalable Vector Graphics) symbols look sharp at any zoom level or print resolution.
Managing Custom Symbols
Select Entity ➡ Manage Custom Symbols to display a dialog that lists all of the custom symbols embedded in your document, and also provides options for adding additional symbols, seeing which symbols are currently in use, and removing symbols from your document. Flying Logic will warn you if you attempt to remove a symbol that is currently in use.
Working With Edges
In Flying Logic, entities are connected to one another by causal relationships represented by edges. Each edge has a direction indicated by its arrowhead. In the way a Flying Logic document is set up by default, each edge represents the principle of sufficient cause. In other words, the existence of the state of affairs described by the entity at the tail of the arrow is sufficient to cause the state of affairs described by the entity at the head of the arrow. For a discussion of other possible ways to set up the meaning of edges, see Operators.
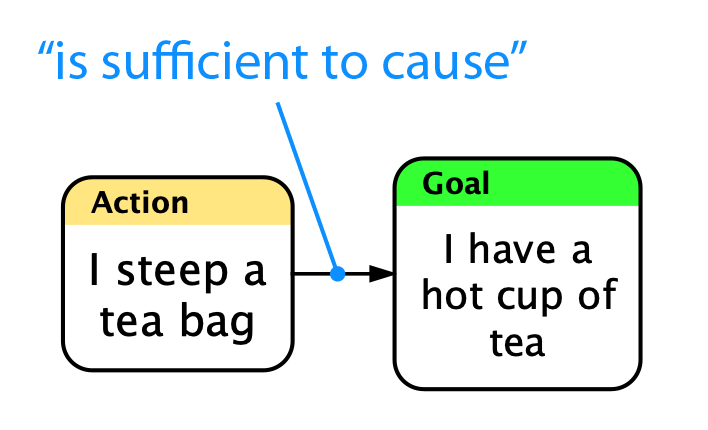
When there are two or more sufficient causes of an entity, then two or more edges point to it. The meaning here is that either OR both of the causes being true makes the effect true.
Creating Edges
To create an edge between entities, click and drag from the cause to the effect. While you drag, a distinctive gesture arrow appears to confirm that you are creating a connection.
Like other graph elements, edges may have annotations attached to them.
To create edges from a selected set of entities to an entity far away in the graph, you can ALT-Left-Click (Option-Left-Click on Mac) on that other entity.
Parallel Edges
Flying Logic disallows parallel edges, in other words: more than one edge from a particular cause to a particular effect.
Back Edges
Flying Logic supports back edges (also called cyclic edges or loops), which are edges that (directly or indirectly) make an effect to be its own cause. When a connection is made that requires a loop, a back edge is created automatically. Back edges are thicker than regular edges.
Unlike regular edges, back edges do not participate in calculations— confidence values do not flow through them and their weights are ignored. They can be annotated like any other edge. Supporting back edges allows relationships such as virtuous and vicious circles to be diagrammed, while keeping the basic model a directed acyclic graph.
Moving Edges
As you build your diagram, you will often discover that the head or tail of an edge needs to be moved to a different entity (or junctor). This is easily accomplished by clicking and dragging near the end of the edge you want to move and dropping over the entity (or junctor) where you want to reconnect it. Before you click, you will see a highlight appear near the end of the edge that you will be moving. While you drag, a distinctive gesture arrow with a circular head appears to confirm that you are moving an edge. You can also drop over another edge, which will cause a new junctor to be inserted on that edge.
Reversing Edges
Edges normally point from causes to effects. If you discover that your document has an edge pointing “backwards” from an effect to a cause, this can easily be fixed by reversing the edge. All currently selected edges can be reversed with the Edit ➡ Reverse Selected Edges command. Note that “reversal” here refers to swapping the elements at the head and tail of an edge, and not to the direction the edge points, which is usually determined by the Orientation popup of the Layout Inspector.
Swapping Elements
You can also swap any two elements of the same kind with the Edit ➡ Swap Selected Elements command. This command simply causes the two selected elements of the same kind (entities, junctors, edges, or groups) to switch places, including any attributes such as annotations, edge weights, or group color.
Swapping Forward and Back Edges
When you are creating diagrams that involve back edges, it is sometimes nice to be able to choose which edge in a loop should flow against the direction of the rest of the document. You can accomplish this by selecting a back edge and a forward edge, then choosing the Edit ➡ Swap Selected Forward and Back Edges command.
Working With Junctors
Frequently, effects are brought about only by the several causes in combination. Junctors are small circles that contain the name of an operator such as AND or OR. Since more than one edge entering an entity is, by default, already considered to be an OR operation, junctors are often used to represent AND, which is the idea of necessary condition: that several causes are each necessary but none of them alone is sufficient.
Creating Junctors
As we’ve seen, creating edges is as simple as dragging from cause to effect. Creating junctors is equally simple: drag from the cause to the edge where the new junctor should appear. You can also right-click (Mac, Windows, Linux) or Control-click (Mac) an edge and select an operator type from the Insert Junctor section of the popup menu.
Any combination of dragging from entities, edges, or junctors to other entities, edges, or junctors will result in a new connection being made, as long as it would not result in a parallel edge. If the start or end (or both) of the drag is an edge, a new junctor will be inserted there and the new edge connected to it.
Preconditions are causes that are outside of your control, while Actions are causes inside your control. For more information about the entity classes used in these examples, see Thinking with Flying Logic.
Entities, Junctors, and Edges
There is a difference between how entities and junctors are related to the edges that connect them. The existence of entities is independent of their edges, while the existence of junctors is dependent on their edges. That is, an entity can exist whether or not it is connected to any other part of the diagram: it may have edges entering it or leaving it, or both, or it may be unconnected to anything. On the other hand, junctors must always have at least one edge coming in and one edge going out— if the last edge either entering or leaving a junctor is removed, the junctor itself will also be automatically removed.
Working With Groups
Groups help you organize your diagram and manage the complexity of larger diagrams. Groups appear as shaded rectangles that enclose entities, junctors, and other groups. Like entities, groups may have both titles and annotations, which are edited in exactly the same ways as for entities.
Creating Groups
You can create groups using the Entity ➡ New Group command, or by clicking the New Group button on the toolbar.
- If there is no selection, the new group will be created by itself outside all other groups.
- If there is a selection, the new group will enclose every element in the selection.
Setting the Group Title
To change the title of a group: double-click it, edit the text in the field that appears, then click outside the field to finish the change.
Arranging Grouped Elements
Individual elements and selected sets of elements can be moved into, out of, and between groups by dragging. First, select the elements you wish to move to a different group. Then drag any of the selected elements into the new group. While you drag, a distinctive gesture arrow with a square head appears to confirm you are rearranging objects within groups. Groups can also be nested within other groups using this technique, and you can also move elements out of any group by dragging to the gray canvas background.
Collapsing and Expanding Groups
Groups can be collapsed (or expanded) to hide (or reveal) their enclosed elements.
- To collapse (or expand) a group, click the small triangle that appears in its upper-left corner. Option-click (Mac) or Alt-click (Windows) to collapse (or expand) all nested groups within the group as well.
- The Group Tab of the Element Inspector contains four buttons that explicitly perform the above operations: Collapse, Expand, Deep Collapse, and Deep Expand
When a group is collapsed, any edges connected to elements both inside and outside the group appear to be attached to the group. Expanding the group will show the actual point of attachment.
Group Colors
The Group tab of the Element Inspector contains a popup menu that lets you select the color of the currently selected group(s). This can be useful as a way of visually identifying or categorizing groups.
Assigning Symbols to Groups
Like entities, groups can also be marked with a symbol. Select one or more groups then select the desired symbol from the Icon Popup in the Group tab of the Element Inspector. To remove a symbol, select the 🚫 icon in the upper-left corner of the popup.
Hoisting
Hoisting views the contents of a single group as the entire contents of the canvas, as if it had been raised (hoisted) up to the top level. Hoisting makes it much more convenient to work on parts of documents that are nested within groups, even down several levels.
In the following illustration, we wish to work purely inside Group 2. To do so, select the group, then the Group ➡ Hoist Selected Group command. After hoisting, the canvas only contains elements from within Group 2, as well as edges that enter or leave it along with icons representing the entities at the other end of those edges. The icons cannot be edited, and in fact they are part of the entering or leaving edge itself.
Let’s say that after editing Group 2 for awhile, we need to see its contextual parent group, Group 1, but we’re not yet ready to unhoist all the way back to the top. Selecting the Group ➡ Unhoist One Level command accomplishes this.
To return to the top level at this point, we could either select the Group ➡ Unhoist One Level command again, or use the Group ➡ Unhoist to Top command, which would return us to the top level no matter which group was previously hoisted.
When a group is hoisted, the Path Bar appears along the top of the canvas, indicating how many levels deep you are viewing, and the names of the groups you must traverse to get back to the top level:
Clicking any segment of the Path Bar to the left of the last one unhoists to that level in a single step.
Flying Logic does not save the current hoisting level in the document file. Therefore, each time you open a document Flying Logic will show the entire document, even if it was saved while a group was hoisted.
Printing or exporting a Flying Logic document in image formats such as JPG, PNG, or PDF takes into account the groups you have collapsed and the currently hoisted group, if any, along with your other layout settings. In other words, what you see before you export or print is what you will get in the resulting output. Exporting in non-image formats like Microsoft Project or OPML always exports the entire document.
Selections
Flying Logic lets you select several diagram elements upon which to perform operations.
- You can select an individual element by clicking it.
- You can use the arrow keys to move the selection from element to element.
- Additional elements can be selected (or deselected) by Shift-clicking.
- Holding down the Shift key and pressing the arrow keys “expands” the selection in the direction you specify.
- Marquee selection can be used to select several elements with one gesture. Option-click (Mac) or Control-click (Windows or Linux) in the gray background area of the graph and drag the selection rectangle over the elements you wish to select. Additionally, starting marquee selection with Shift-Option-click (Mac) or Shift-Control-click (Windows or Linux) will toggle the selected/not-selected state of the objects you drag over. If you begin your marquee selection inside a group, only elements within that group are eligible for selection.
Deleting Selections
All selected elements can be deleted by pressing the Delete key, or by clicking the Delete button in the toolbar. Like all Flying Logic actions, deletion is undoable.
Deleting a group does not automatically delete any enclosed elements (unless they are also explicitly selected.) Instead, the enclosed elements are “promoted” to the next higher group, if any. Deleting a selected group along with all its enclosed elements (including other groups) can be accomplished by pressing Command-Delete (Mac) or Control-Delete (Windows).
Copy and Paste
Selected elements can be cut, copied, and pasted within and between Flying Logic documents. When you make a selection and select the Edit ➡ Copy or Edit ➡ Cut command, or click the corresponding toolbar icons, the selection becomes shaded orange (for copy) or red (for cut). You can cancel a pending Copy or Cut any time by pressing Escape. Once you have a shaded selection, select the group (or no group at all) in any document you wish to transfer the elements to and select Edit ➡ Paste or click the Paste toolbar icon.
Layout
Your job is to make a diagram that accurately models your problem. Other than a few simple choices, such as whether your diagram flows from bottom-to-top or left-to-right, working out how the various graph elements are laid out is purely Flying Logic’s job. Sometimes Flying Logic may surprise you by making layout choices different from those you might have made, but it will often make better choices than most people, especially when the graph becomes complex. Each time you change the structure of the graph, Flying Logic uses animated transitions to show you what has changed. You can control the speed of the animation. See Preferences.
Orientation
Flying Logic documents “flow” in a direction specified by the Orientation Popup of the Layout Inspector. Which you choose for your diagram depends on the usual flow for the kind of diagram you are creating, compactness, or simply which one looks best to you.
If you find yourself using one orientation for new documents, you can select the default orientation used by new documents. See Preferences.
Side-To-Side Orientations
Use the side-to-side orientations for diagrams that naturally represent dependency flows.
Layout Orientation
Radial Orientations
Use the radial orientations for diagrams that naturally represent trees or parts explosions.
.png)
Inner to Outer Radial Layout
.png)
Outer to Inner Radial Layout
Radial orientations work best when the diagram is a true tree— that is, where each “parent” entity may have multiple “children”, but where each “child” may only have a single “parent”. Whether you choose Inner To Outer or Outer to Inner depends on whether you want arrows pointing outward or inward with respect to the root of your diagram.
Changing Orientation does not change which entities are at the head and tail of edges: if you need to reverse edges in one step, simply use the Edit ➡ Reverse Selected Edges command.
Bias
The layout bias of a document tells Flying Logic whether to prefer pushing elements closer to the start of the flow, or closer to the end of the flow. Which you choose can strongly impact the style of your diagram.
Compactness
The compactness of a document controls the tightness of the the space between entities.
Incremental Layout
Each time you change your document, Flying Logic lays it out again in order to keep the diagram compact and minimize edge crossings. Normally, Flying Logic performs a full, “from scratch” layout of your diagram, which results in a highly efficient and clear result. However, this full layout does not take into account the starting position of the graph elements, and therefore can sometimes cause a large amount of visual change, even causing the entire diagram to appear to flip over. These large shifts can make it hard to follow even small changes, and the larger the diagram, the worse the problem.
By turning on Incremental Layout using either the toolbar icon or the View ➡ Incremental Layout command, you tell Flying Logic that you want to have each layout depend on the results of the previous layout. In the following illustration with Incremental Layout on, the relative positions of all the entities stay mostly the same.
The advantage of Incremental Layout is that you can make a large number of changes to your document with less visual disturbance. The downside is that with Incremental Layout on, the layout will get progressively less efficient, particularly in its use of space. You may also see edges flowing against the general flow of the layout, or unnecessary line-crossings being introduced. When it is convenient, you can turn off Incremental Layout to cause Flying Logic to do a full layout.
Flying Logic does not save the position of a document’s elements (the result of the layout) in the document file. Therefore, each time you open a document, Flying Logic will perform a new, full layout, even if it was saved while Incremental Layout was on.
Managing Large Documents
Keep the following guidelines in mind when working with large Flying Logic documents.
Managing Memory
Flying Logic provides a Memory Gauge to the right of the Title Editor in each document window that shows the amounts of memory in use (dark blue) currently allocated to Flying Logic (medium blue) relative to the maximum the application will ever request (light blue).
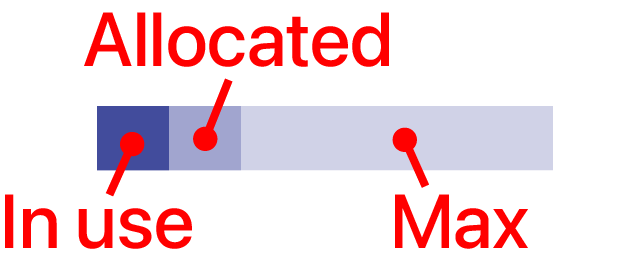
As you work, the dark blue bar will rise and fall again as Flying Logic reclaims unused memory. As your document becomes larger, the medium blue bar will also grow, but will never get smaller until you restart Flying Logic. Memory only becomes a serious consideration when the dark blue bar starts occupying the entire width of the Memory Gauge most of the time. If this happens, try closing unnecessary documents or restarting Flying Logic.
Managing Graphic Complexity
You may notice that Flying Logic redraws, animates, or responds to user actions more slowly when a diagram becomes large and complex. Here are some ways to mitigate this:
- Use groups to enclose parts of your diagram you’re not working on, and then collapse those groups. Collapsed groups are fast to draw and can contain any number of diagram elements.
- Use the Zoom control to display less of the diagram at one time.
- Use the Navigation Inspector to move around a large document.
- Use Hoist to focus on particular groups you're working within.
- Experiment with the Display Animation Preferences settings. See Preferences.
- Consider breaking your diagram into two or more sub-diagrams in separate documents.
Graph Logic
Flying Logic provides tools for you to test and work with the logic of your diagrams.
Confidence Spinners
By selecting the View ➡ Confidence command or clicking the Confidence toolbar icon, each entity reveals a small circle called a spinner. Confidence spinners represent a single numeric value that can be thought of as a percentage from 0% to 100% (0.0 to 1.0). You can use Flying Logic’s preferences to choose whether spinners are displayed with shading only (no symbol), a numeric value from 0 to 100, or a symbol, which for confidence spinners displays F (false) for 0%, T (true) for 100%, and shading only for other values. See Preferences.
Setting Confidence Values
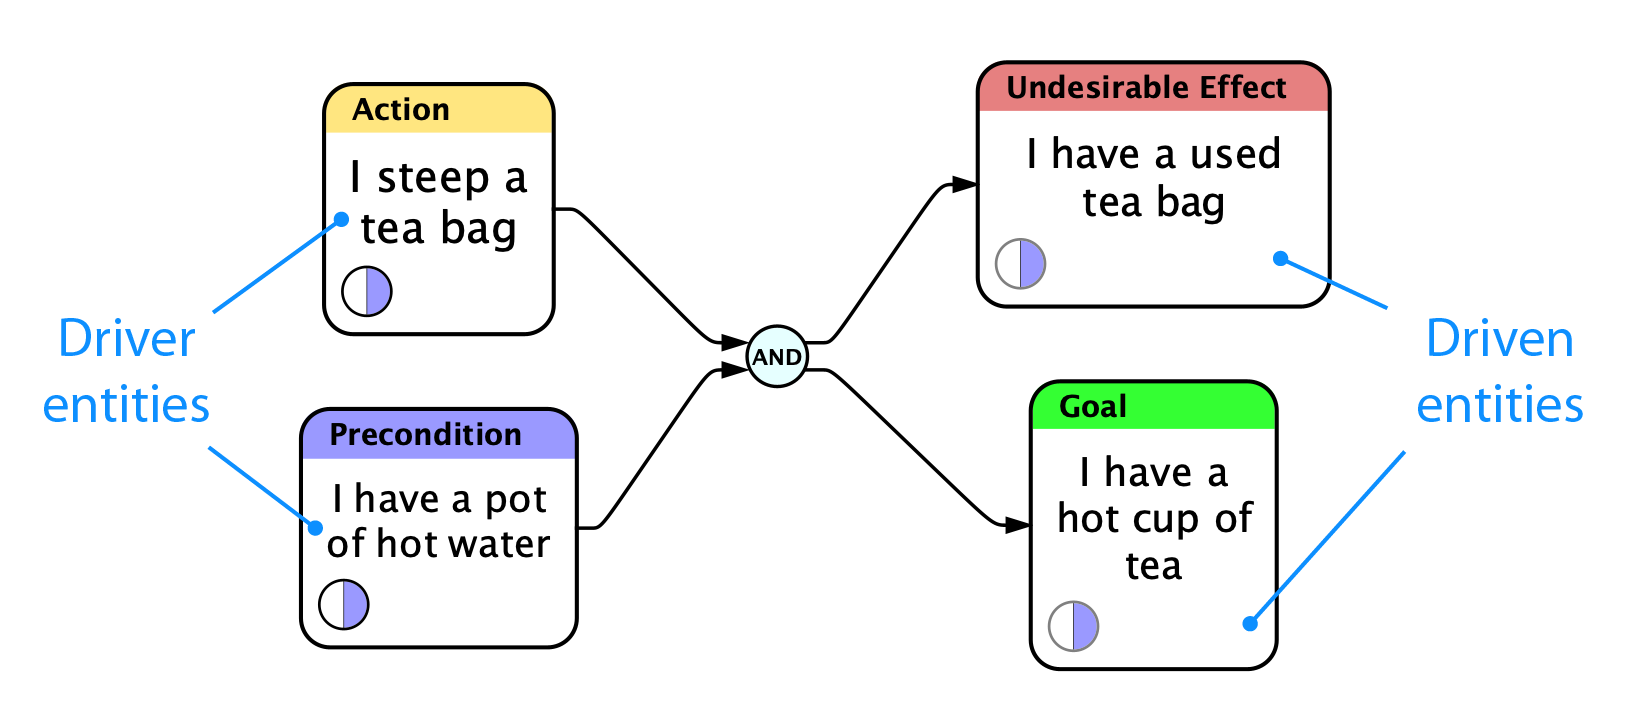
Entities that have no incoming edges are drivers, and the value of their confidence spinner can be changed directly by clicking and dragging on the spinner. Entities that have one or more incoming edges are driven, and their confidence value is purely the result of how their inputs are combined. Spinners of driven entities are bordered by a gray circle, and dragging on them has no effect. For drivers, you can drag right or up to increase the spinner’s value, and left or down to decrease it. As you drag, all driven entities affected by your changes are updated simultaneously.
You can also hold down the Shift key while dragging to constrain the spinner’s value to increments of 5%, and (while the mouse button is still down) use the arrow keys on your keyboard to “nudge” the spinner’s value up or down in 1% increments.
Finally, you can use keypresses to change the confidence values of all selected driver entities. Pressing the ‘1’ key through the ‘9’ key changes the confidence values from 10% to 90%, while pressing the ‘T’ key (for True) changes it to 100%, pressing the ‘F’ key (for False) or ‘0’ (zero) key changes it to 0%, and pressing the ‘U’ key (for Unknown) changes it to 50%.
The Meaning of “Confidence”
Confidence is simply a numeric value, but what it actually means is subject to the needs of your project and the operators you use to manipulate it. In the way Flying Logic documents are set up by default, the confidence value can be thought of as your level of confidence that the state of affairs described by a given entity holds. If the spinner is 0% shaded then you are expressing absolute certainty that the entity does not hold (logical False.) If the spinner is 100% shaded then you are expressing absolute certainty that the entity does hold (logical True.) If the spinner is 50% shaded, then you are expressing a logical Indeterminacy which could mean either no opinion or conflicting opinions about whether the entity holds.
There is a useful distinction between having no opinion and having conflicting opinions on a subject, although Flying Logic does not currently support modeling that distinction. In the case of having no opinion, you are asserting neither truth nor falsehood. In the case of having conflicting opinions, you are asserting both truth and falsehood. There are mathematically valid ways of representing such paraconsistent logic that Flying Logic may support in the future. For typical applications, it is usually most useful to think of confidence values of 50% as meaning no opinion.
Probability vs. Fuzziness
It is important to understand that in the way Flying Logic documents are set up by default, confidence values represent fuzzy boolean values, not probabilities. The basic distinction to remember is that probabilities deal with the uncertainty or likelihood of whether something may occur, while fuzzy logic (from which fuzzy booleans derive) deals with ambiguity or vagueness about what has, or has not, occurred. The following statement is probabilistic:
The water in the pot may get hot.
...While the following statement is fuzzy:
The water in the pot is hot enough.
Combining probabilities is done using multiplication, as in the case of determining the probability of two coin flips both coming up heads (50% × 50% = 25%). To combine fuzzy statements you use fuzzy AND, OR, and NOT operators, which correspond to mathematical minimization, maximization, and complement. (“hot water” AND “steep tea bag” SUFFICIENT FOR “hot tea”). So far we have seen examples of AND and OR. See Edge Weights for a discussion of fuzzy NOT. See Operators for a discussion of how to set up Flying Logic documents for probabilities.
Operators
Confidence values flow through the entities, edges, and junctors of a Flying Logic document, being modified along the way by the operators they encounter. This section discusses the operators found on entities and junctors— edges also perform a weighting function discussed in Edge Weights.
Numeric Data Types
Confidence values are represented as one of two data types: fuzzy boolean or floating-point. The primary difference between the two types is that fuzzy booleans are restricted to the range 0.0 to 1.0, while floating-point values are not. Some of the operators in this section are primarily for use when dealing with fuzzy booleans, some are primarily for dealing with floating-point values, and some work just as well with either. Generally, if the result of an operation is outside the range of a fuzzy boolean, it will automatically be converted to a floating-point value. Flying Logic displays different kinds of edge arrowheads depending on whether a fuzzy boolean or floating-point value is flowing through it.
For now, all numeric input and output in Flying Logic is handled by spinners, which can only handle the range 0.0 to 1.0 (for confidence values) or -1.0 to 1.0 (for edge weights.) It is expected that a future version of Flying Logic will incorporate more data types and additional methods for their input and output.
.png)
In the above example, the results of the Sum junctor are 1.25, and since this value is out of the fuzzy boolean range, the arrow leaving the Sum junctor has an open arrowhead, indicating a floating-point value. This value cannot be displayed by confidence spinners, and as a result the spinner of entity C turns red. However, the correct value is propagated, as seen from the results of the Product junctor displayed in entity E.
Basic Operators
The Basic Operators are sufficient for creating diagrams that support the TOC Thinking Processes.
| Fuzzy AND | AND | Returns the minimum of its inputs. Inputs are interpreted as “necessary conditions.” Output value is always fuzzy boolean. |
| Fuzzy OR | OR | Returns the maximum of its inputs. Inputs are interpreted as “sufficient causes.” Output value is always fuzzy boolean. |
Advanced Operators
The Advanced Operators are used to support modeling using probabilities and other advanced applications.
| Fuzzy Exclusive Or | XOR | For output to be true, exactly one input must be true. Inputs are interpreted as “sufficient but mutually exclusive causes.” Output value is always fuzzy boolean. |
| Proportion | ∷ | Treats each input as a “vote” of a strength proportional to the confidence value and the edge weight. Edge weights of zero count as abstentions and do not affect the output, which is different from a simple average where each zero input tends to reduce the output. Output value is fuzzy boolean unless at least one input is floating-point, in which case the output is floating-point. |
| Sum | + | Returns the sum of its inputs. Output value is fuzzy boolean unless at least one input is floating-point or the sum is outside the range of a fuzzy boolean, in which case the output is floating-point. |
| Sum Probabilities | ⊕ | Follows the Specific Addition Rule, also called the OR rule. Useful for calculating the probability of two or more independent events causing a particular outcome. For example, the probability of one OR both of two flipped coins coming up heads is 50% ⊕ 50% = 75%. Output value is fuzzy boolean unless at least one input is floating-point, in which case the output is floating-point. |
| Product | × | Returns the product of its inputs. Often used to determine the probabilities of two or more independent events occurring together (the Specific Multiplication Rule, also called the AND rule.) For example, the probability of a first AND second coin flip both coming up heads is 50% × 50% = 25%. Output value is fuzzy boolean unless at least one input is floating-point, in which case the output is floating-point. |
| Reciprocal | 1/n | Returns the reciprocal of its input. Output value is always floating-point. Often used to implement division by way of a / b = a (1 / b). If more than one input is present, returns the reciprocal of the sum of its inputs. |
| Negate | -n | Returns the negation of its input. Output value is always floating-point. If more than one input is present, returns the negation of the sum of its inputs. |
| Complement | 1-n | Returns the complement (1-n) of its input. Output value is fuzzy boolean unless at least one input is floating-point or the sum is outside the range of a fuzzy boolean, in which case the output is floating-point. |
| Minimum | MIN | Returns the minimum of its inputs. Output value is fuzzy boolean unless at least one input is floating-point, in which case the output is floating-point. |
| Maximum | MAX | Returns the maximum of its inputs. Output value is fuzzy boolean unless at least one input is floating-point, in which case the output is floating-point. |
| Average | AVG | Returns the average of its inputs. Output value is fuzzy boolean unless at least one input is floating-point, in which case the output is floating-point. |
| Distributor | ☼ | The distributor behaves exactly the same as the Sum (+) operator, but is intended as a convenience for situations where a single input value is to be distributed to several outputs in a location of the diagram far away from where the value was originally produced. |
Junctor Operators
The purpose of junctors is to combine several inputs into an output value using an operator. The name of the operator is displayed on the junctor itself, and is by default Fuzzy And (AND).
Each junctor in a diagram can use a different operator, and the operator that new junctors are created with is set using the Default Junctor Operator popup in the Operators Inspector.
To change the operator of an existing junctor, use one of the following options:
- Select the junctor, then select the desired operator from the Operator Popup in the Junctor Tab of the Element Inspector.
- Right-click (Mac, Windows, Linux) or Control-click (Mac) the junctor and select the desired operator from the popup menu.
Entity Operators
All entities in a diagram have an operator used to combine the confidence values from their incoming edges. By default this operator is Fuzzy Or (OR).
Unlike junctors which can each have a different operator, all entities in a given document have the same operator, which is set using the Entity Operator popup in the Operators Inspector.
Selecting a new Default Junctor Operator only affects junctors created after the change, but selecting a new Entity Operator immediately changes the operator used by all entities in the diagram.
Setting up for Probabilistic Analysis
Usually you will make selections from the Entity Operator and Default Junctor Operator popups in the Operators Inspector just once when you begin building a diagram. If you are building a diagram using a fuzzy methodology such as Effects-Based Planning, the entity operator Fuzzy Or (OR) and the default junctor operator Fuzzy And (AND) will usually be fine (these are the document defaults.) If you are using a probabilistic methodology such as Evidence-Based Analysis, a common setup is to have Sum Probabilities (⊕) as the entity operator and to have Product (×) as the default junctor operator. This setup is analogous to the use of OR and AND in the default (fuzzy) setup. In cases where you are evaluating a belief network and wish to use a more intuitive vote-like setup, you will usually set both the entity operator and default junctor operator to Proportion (∷).
Edge Weights
Just as each entity carries a confidence value, each edge carries a numerical edge weight value. When visible, each edge displays a spinner that indicates its weight.
Edge weights can be displayed for every edge in the diagram, or only for selected edge weights. To show weights for every edge, select the View ➡ Edge Weights command or click the Edge Weights toolbar icon. To display weights for only selected edges, select the edges you desire and then use one of the following options:
- Select the Edge Weight Visible checkbox in the Edge Tab of the Element Inspector.
- Right-click (Mac, Windows, Linux) or Control-click (Mac) any of them and select the Show Selected Edge Weights command from the contextual menu.
The setting for the View ➡ Edge Weights command overrides the settings for showing individual edge weights. When it is turned on, all edge weights will be visible and the individual settings for edges are ignored.
Edge weights can be thought of as percentages from –100% to 100%. Negative weights are represented as red, and positive weights are green. A weight of exactly zero is represented as yellow. The same preference that selects what kind of symbol to display inside of Confidence spinners also controls the symbol displayed inside edge weight spinners. Another preference lets you decide how the color of the edge itself corresponds to the edge weight. By default, edges with positive weights are black, edges with negative weights are red, and edges with zero weights are gray. See Preferences.
.png)
Edge Weights Displayed
In the belief network illustration above, the confidence values of the Knowledge entities represents the strength of belief in each statement, while the edge weights represent the correlation between the knowledge items and the propositions under consideration. The resulting values are combined using the Proportion (∷) operator.
Setting Edge Weight Values
Unlike confidence spinners, there is no “driver/driven” distinction with edge weights— every edge weight may be adjusted independently of all the others. Clicking and dragging on edge weight spinners works the same way as it does for confidence spinners, as does holding down the Shift key to constrain changes to increments of 5%.
You can also use keypresses to change the edge weight values of all selected edges. Pressing the 1 key through the 9 key changes the weight values from 10% to 90%, while pressing the – (minus) key changes it to –100% (logical negation or negative correlation), pressing the + key changes it to 100% (positive correlation), and pressing the 0 (zero) key changes it to 0% (no correlation).
The Edge-Weighting Function
The edge-weighting function is illustrated below. For floating-point values, the result is a simple multiplication. For fuzzy boolean values, the calculation is slightly different. In the case of a simple multiplication, a 100% confidence value (True) multiplied by a 0% edge weight would yield a 0% result (False). What should happen is that a true assertion given no weight should yield an Indeterminate result (neither True nor False). To accomplish this, Flying Logic temporarily converts fuzzy boolean values into the range -100%...100% (like edge weights) multiplies the two values, and then converts the results back into the fuzzy boolean range 0%...100%, which yields the desired result.
.png)
Logical Negation
Edge weights are often used in the probabilistic context of Evidence-Based Analysis. But they are also useful in Effects-Based Planning to represent fuzzy NOT (logical negation.) Even without revealing the edge weight spinners, you can right-click (Mac, Windows, Linux) or Control-click (Mac) an edge and select a positive (+), neutral (0) or negative (–) edge weight from the popup menu that appears. For fuzzy boolean values, negative edge weights represent the logical negation of the input. For more information about Effects-Based Planning and Evidence-Based Analysis, see Thinking with Flying Logic.
.png)
Domains
Domains are groups of classes that you use to solve problems in different ways.
Classes and Domains
Each entity you create is assigned to an entity class (or just class.) Entity classes are a purely visual reminder of the “kind” of each entity: Flying Logic does not in any way restrict the kinds of connections an entity may have based on its class. That said, the methodology you choose or problem domain in which you work may place restrictions on what classes of entities may be connected. For instance, in Effects-Based Planning, Precondition and Action entities should always be drivers (have no incoming edges) while Intermediate Effect and Goal entities should always be driven (have at least one incoming edge.)
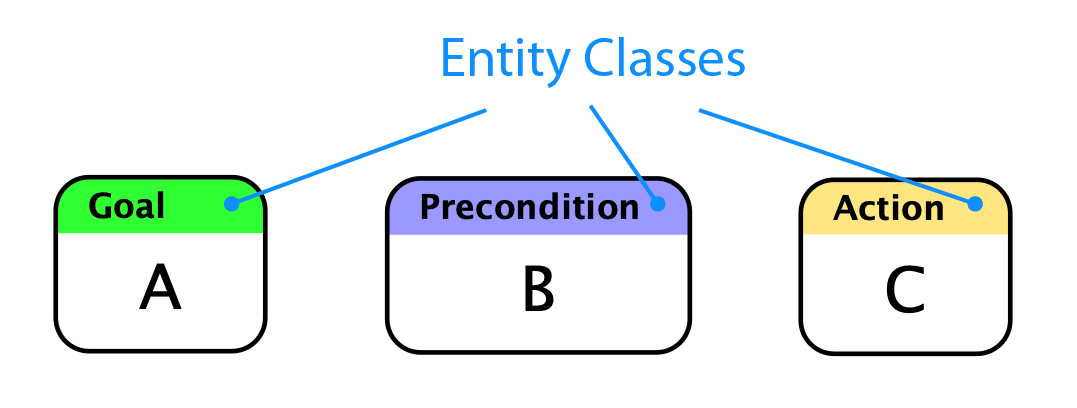
Working with Classes
To create entities with a chosen class, see Working With Entities.
To select all entities of a chosen class, Shift-double-click the class in the Domain Inspector. To change all selected entities to a chosen class, Alt-double-click (Windows or Linux) or Option-double-click (Mac) the class in the entity Domain Inspector. The last two tasks may be performed in sequence to change all entities of one class to another.
Classes are grouped into domains. Domains are used to contain the classes used for creating diagrams in a particular problem domain or using a particular methodology. Double-clicking a domain icon will collapse or expand that domain. Flying Logic has five built-in domains, which cannot be modified, and which are described in Thinking with Flying Logic:
- General, which contains two classes, Generic and Note
- Effects-Based Planning
- Evidence-Based Analysis
- Conflict Resolution
- Prerequisite Tree
Creating Custom Classes
Although Flying Logic’s built-in classes are useful for many general purposes, in your field you may have particular classes you need to work with. Flying Logic allows you to create the domains and classes you need, and re-use them in the documents you create. Because the built-in domains and classes are not modifiable, before you can create any custom classes you must create at least one custom domain.
Creating A Custom Domain
- Select the Domain ➡ New Domain command, or click the New Domain button
 at the bottom of the Domain Inspector. The custom domain is created and added to the class list, and the Edit Domain dialog appears.
 - Type a name for the new domain and click the dialog’s close box.
Creating A Custom Class
- In the Domain Inspector, select one of the custom domains you have created in which you want the custom class to appear, or the existing custom class after which you want the new custom class to be added.
- Select the Domain ➡ New Class command, or click the New Class button <img src="assets/new-class.svg" class="icon""> at the bottom of the Domain Inspector. The custom class is created and added to the selected domain, and the Edit Class dialog appears.
- Type a name for the new class, select a color for the class from the color chooser, and if desired select a default icon to appear on all entities of that class from the Icon Popup in the Edit Class dialog.
- Choose whether you want entities of this class to display the class name in a colored stripe at the top of the entity rectangle. If you turn off Show Name, entities of this class will appear with no class name and their entire background will take on the color of the class.
- If you will be enabling the project management feature, you may want to choose whether an entity based on this class is a milestone (zero effort) and how resources are assigned.
- Click the dialog’s close box. You can now use the new class in your diagram just as you use the built-in classes.
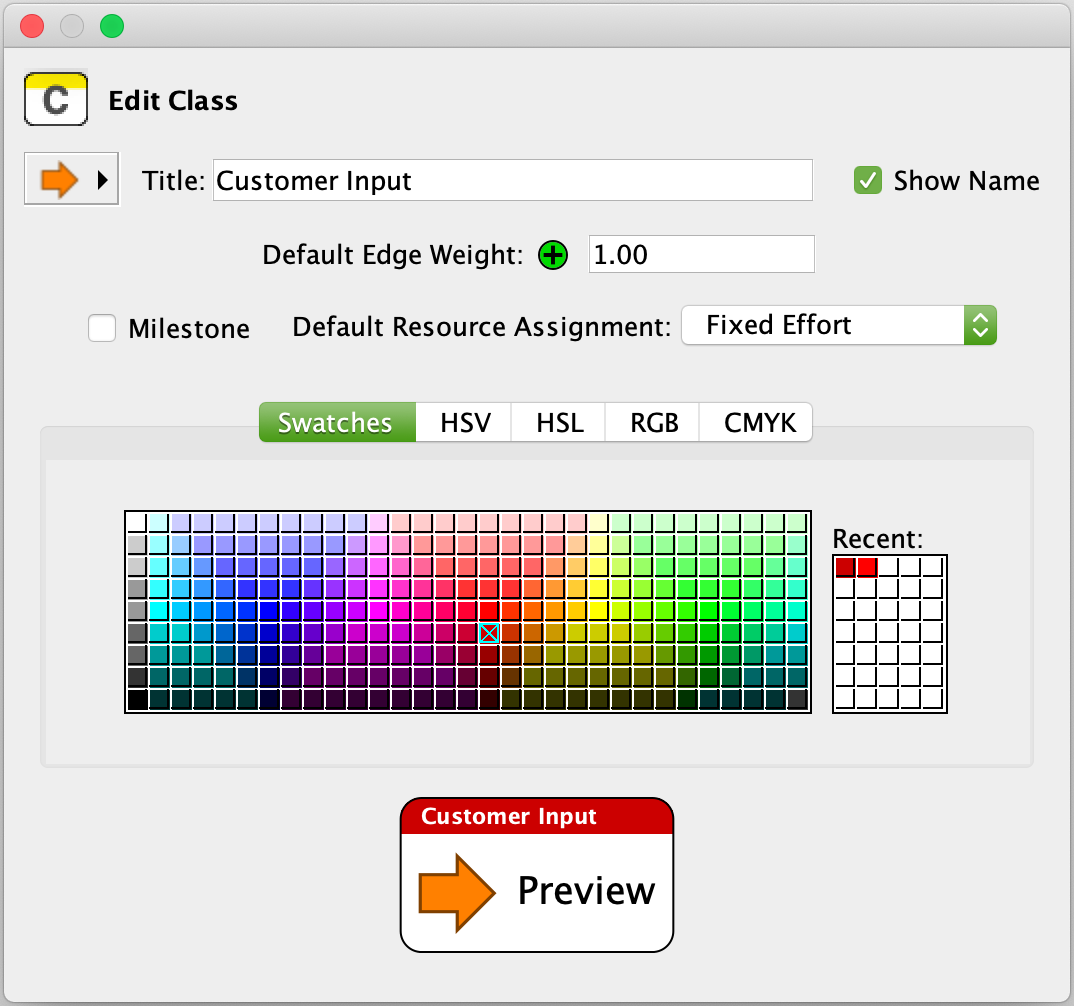
Changing Existing Domains and Classes
To change the name of an existing custom domain or the name, color, or icon of an existing custom class, select the domain or class and click the Inspect button ![]() at the bottom of the Domain Inspector.
at the bottom of the Domain Inspector.
If you change the icon of a class, and all the existing entities of that class do not change their icon to match, then those entities have had their icon “overridden” by the setting of the Icon Popup menu. To correct, select the entities and then select the ![]() icon from the Icon Popup in the Entity tab of the Element Inspector. For more information, see Assigning Symbols to Entities.
icon from the Icon Popup in the Entity tab of the Element Inspector. For more information, see Assigning Symbols to Entities.
To delete a custom domain or class, select the domain or class to be deleted and click the delete button 🚫 at the bottom of the Domain Inspector.
You can also drag entity classes to re-arrange them within or between domains.
Exporting and Importing Domains
Frequently you will want to re-use the custom domains you create across many documents. Flying Logic supports exporting custom domains, as well as importing custom domains and the classes they contain.
To export a domain, select it in the Domain Inspector, then select the Entity ➡ Export Selected Domain command. The domain file will be saved in the location you specify.
To import a domain, select the Entity ➡ Import Domain command, and choose the domain file you wish to import. The category and its classes are added to your document.
You can also create a new, blank document with an exported domain already available by selecting the domain file in the dialog presented by the File ➡ Open command, or by double-clicking the domain file in your desktop environment.
You can only export or import an entire domain and all of its classes; you cannot export or import individual classes.
Resolving Conflicts When Importing
Each custom entity class carries a unique, hidden identifier that is created when the class is created, and that never changes even when the name or other attributes of the class changes. These identifiers are exported along with each custom class in the exported category. When a category is imported, a check is done to determine whether any of the identifiers of the classes being imported conflict with the identifiers of the classes already in the document. If any do, it is assumed that an updated version of the category is being imported, and the names and colors of the classes being imported override those already in the document. A notification is provided to you when this occurs, and if the results are not what you expect, you can use the Undo command to revert to the state of your document before the import.
Customizing Domain Visibility
Flying Logic documents often combine entities of classes across several domains. However, there are times you’d rather not see one or more built-in or custom domains in the Domain Inspector. You can hide such domains easily, and your choices of hidden domains are saved along with your document:
- Uncheck the name of the domain to be hidden in the Domain ➡ Domain Visibility submenu, or...
- In the Domain Inspector, right-click (Mac, Windows, Linux) or control-click (Mac) the domain and select the Hide Domain “Name” command from the popup menu.
To show a previously hidden domain:
- Check the name of the domain to be shown in the Domain ➡ Domain Visibility submenu.
To save all currently visible domains (and all hidden domains) as the default for new documents:
- Select Domain ➡ Save Domains as Defaults.
This command also gives you the option to restore the list of visible domains to the factory defaults.
Chart View
The diagrams created in Flying Logic can be displayed in a second way called Chart View. This view is activated for a document by selecting the View ➡ Switch to Chart View command, which changes to Switch to Graph View when Chart View is active. In this mode each entity, junctor, and group is shown as one row of a chart. The top-most row displays the entity or group that would appear at the top of a Top-to-Bottom layout in Graph View, while the bottom-most row displays the entity or group that would appear at the bottom.
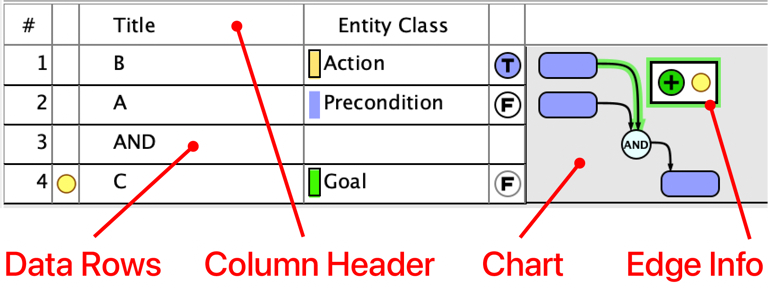
Each row is divided into two parts. On the left are a series of columns containing information about the element in that row. On the right is the actual display of that element, similar to Graph View.
The set of columns to be shown can be modified based on both document-wide settings (like Confidence), while others can be selected by using the context menu for the column header row (like Entity Class). The width of the entity title and class columns can be changed by dragging the separator line at the right of the column in the Chart View header.
The elements in the diagram can be manipulated in Chart view just like in Graph view, including selecting, reconnecting, and moving elements between groups. Inline editing of entity titles can be activated by double-clicking on an entity, and all context menus are available.
As the result of the density of edges in the diagram in Chart view, only one selected edge has its weight and annotation shown at a time. These appear in an Edge Info box that floats next to the edge. The weight can be manipulated just as in graph view, and a tooltip will appear when the mouse cursor is over the annotation icon. The box does not appear if the edge has no visible weight or annotation.
Additional columns and diagram features appear when Project Management is enabled. See Project Management.
Scripting
Flying Logic includes a powerful scripting system based on the Python™ programming language.
Flying Logic includes a powerful scripting system based on the Python™ programming language. Scripts can be used to create or manipulate Flying Logic documents, and create importers and exporters that allow foreign file types to be loaded and saved directly from within Flying Logic.
Most of the details of how the built-in Python interpreter interacts with Flying Logic are detailed in the Flying Logic Scripting Guide. This section describes only the basic scripting features and commands.
Currently Flying Logic has no integrated code editor for scripting. Therefore, you will write your script files (ending with the “.py” extension) using an external text editor or programming environment, and then provide them to Flying Logic for execution.
Running a General-Purpose Script
To run a general-purpose script that either creates a new Flying Logic document or performs operations on the frontmost open document, use the Edit ➡ Run Script ➡ Open Script… command. For your convenience, the last four scripts run are remembered in the Run Script submenu.
Importing via Script
To convert a foreign file format to a Flying Logic document via a script-based importer, use the File ➡ Import ➡ Import Via Script ➡ Open Script… command. For your convenience, the last four importers run are remembered in the Import Via Script submenu.
Exporting via Script
To convert the frontmost Flying Logic document to a foreign file format via a script-based exporter, use the File ➡ Export ➡ Export Via Script ➡ Open Script… command. For your convenience, the last four exporters run are remembered in the Export Via Script submenu.
User-Defined Attributes
The User-Defined Attributes Inspector is used manage custom name-value pairs in any Flying Logic document element or in the document itself. This data can be accessed or modified directly from scripts.
Menus
All of Flying Logic's menu commands and their functionality.
Application Menu (Mac)
| About Flying Logic | Displays version information and credits. |
| Preferences... | Displays the Preferences dialog. See Preferences. |
| Quit Flying Logic | Quits Flying Logic. Unsaved work will be auto-saved and reopened the next time Flying Logic is started. |
File Menu
| New Document | Creates a new, blank document. |
| New Document From Selection | Creates a new document containing copies of any elements that were selected in the current document. |
| Open... | Opens an existing document. New documents can also be opened by dragging a Flying Logic document to the application icon (Windows: in Windows Explorer, Mac: in the Finder or Dock, Linux: see your window manager documentation.) Template files can also be opened, which open as new Untitled documents containing the contents of the template. Existing exported domain files can also be opened, which causes a new, blank document to be created with the domain automatically imported. |
| Open Examples... | Allows browsing and opening of a variety of provided example documents. Example documents open as new, untitled documents so you can modify them and save them elsewhere. |
| Open Recent | Select a name from the submenu to re-open a recently open document. |
| Close Tab | Closes the current document tab. The user is prompted to save any unsaved changes. If only one document is open in a window, this closes the document and window. |
| Close Window | Closes the current document window. If multiple documents are open in a window, the application attempts to close them all. The user is prompted to save any unsaved changes. |
| Save | Saves the current document. If the document has not been saved before, the user is prompted for a file name and folder to save to. |
| Save As... | Saves the current document in a new location and/or with a new name. |
| Save as Template... | Saves a copy of the current document in a new location with a new name, and changes its filename suffix to .xlogict. When a template file is opened, it opens as a new, Untitled document, but starts with all the content that was saved with the template. |
Import Submenu
Import Diagram from CSV... | Imports a diagram from a simple CSV (comma-separated values) text document. For the format of this document, see the Flying Logic Scripting Guide. |
Import from MS Project... | Imports a diagram from an MS Project document in either XML or MPX format. The diagram may include extra elements to properly represent features from MS Project. See the section Notes on MS Project Import and Export in Project Management. |
Import via Script Submenu
| Open Script... | Executes the selected script as an importer of the current document. For convenience, the submenu also remembers the last four scripts run this way. |
Export Submenu
Export of diagrams to PDF, PNG and JPEG support a Save Ink option identical to that available when printing: group backgrounds are not shaded.
| Export Diagram as PDF... | Creates a PDF file with the diagram of the current document. The document is formatted as a single page large enough to contain the entire diagram. |
| Export Diagram as JPEG... | Creates a JPEG file with the diagram of the current document. The document is formatted as a single image large enough to contain the entire diagram. |
| Export Diagram as PNG... | Creates a PNG file with the diagram of the current document. The document is formatted as a single page large enough to contain the entire diagram. |
| Export Diagram as Graphviz (DOT)... | Creates a file in the DOT graph description language used by the Graphviz open source graph visualization toolkit. |
| Export Diagram as Scalable Vector Graphics (SVG)... | Creates a Scalable Vector Graphics (SVG) file with the diagram of the current document. The document is formatted as a single page large enough to contain the entire diagram. |
| Export Outline as OPML... | Creates an OPML file with the diagram of the current document. OPML documents can be directly imported into many popular outliner applications. |
| Export Annotations as PDF... | Creates a PDF file with only the annotations in the current document. Each annotation includes its annotation number, which can be cross-referenced with the annotation numbers that appear when the View ➡ Note Numbers command is turned on. |
| Export Annotations as Text... | Creates a plain text file with only the annotations in the current document. Each annotation includes its annotation number, which can be cross-referenced with the annotation numbers that appear when the View ➡ Note Numbers command is turned on. |
| Export as MS Project Data Interchange (XML)... | Exports the current document in MS Project Data Interchange format, which is a format based on XML used to exchange Microsoft Project data. See below for details on the conversion of Flying Logic documents to MS Project documents. |
| Export as MS Project Exchange (MPX)... | Exports the current document in MPX format. MPX is a native binary format used to exchange Microsoft Project data. See below for details on the conversion of Flying Logic documents to MS Project documents. |
| Export as Realization Concerto (JSON)... | Exports the current document in JSON format, which can then be imported into Realization Concerto. |
PDF is the most desirable format for publishing and all other applications that do not require a “bitmapped” graphics format (such as JPEG or PNG), as PDF images will scale to any size with no loss of quality. PDF also supports transparency, and will look good when overlaid against backgrounds containing images or textures.
JPEG images are compressed, and may show a slight fuzziness around the edges of lines and text. Also, JPEG images do not support transparency, so programs that overlay images on backgrounds (such as presentation software) will show the JPEG as completely obscuring any background. Exporting the image to PDF or PNG is recommended when transparency is desired.
PNG images use a “lossless” form of compression that does not result in the edge-fuzziness associated with JPEG images. Also, PNG images support transparency, and will look good when overlaid against backgrounds containing images or textures.
Note numbers change as annotations are added and removed from the document, and should not be relied on to stay the same across document revisions.
Export to MPX is only still provided for users who must use older versions of Microsoft Project that do not import the XML format above. Certain attributes may not be exported correctly when using this command.
Exporting to MS Project
When exporting to MS Project, the following conversion rules apply:
- All entities are converted to MS Project Tasks of the same effort assigned in the Entity tab of the Element inspector when Project Management is turned on, or 1-day effort if no other effort has been specified. Zero-effort tasks are converted to MS Project milestones. The name of the task is the entity’s title. The
Text1field of the task is set toEntity. TheText2field of the task is set to the entity class name. TheNumber1field of the task is set to the confidence value of the entity. - All junctors are converted to MS Project milestones. The name of the task is the name of the junctor operator. The
Text1field of the milestone is set toJunctor. TheNumber1field of the task is set to the confidence value of the junctor. - All groups are converted to MS Project summary tasks. The name of the summary task is the title of the group. The
Text1field of the summary task is set toGroup. - All edges are converted to finish-to-start dependencies with no lag.
- Notes for entities, groups, and junctors become notes on the corresponding tasks. Notes on edges are not preserved, because MS Project does not support notes on task dependencies.
There is an option that allows the use of the "high" custom fields when exporting. Text30 is used instead of Text1, Text29 instead of Text2, and Number20 instead of Number1. Alternately, you can skip exporting this information.
Export via Script Submenu
| ➡ Open Script... | Executes the selected script as an exporter of the current document. For convenience, the submenu also remembers the last four scripts run this way. |
| Prints the current document. The Flying Logic print options dialog appears before the system print dialog, and allows a number of choices for formatting your printed output. |
Edit Menu
| Undo | Undoes the last action that modified the current document. Virtually every action that modifies Flying Logic documents is undoable, and multiple levels of undo are supported. You can set a preference as to how many levels of undo to support. See Preferences. |
| Redo | Redoes the last undone action. |
| Cut | Works as a typical Cut command for text. For selections of the diagram, marks the selected elements for transfer to another document or another location in the current document. Selected elements are shaded red. See Copy and Paste. |
| Copy | Works as a typical Copy command for text. For selections of the diagram, marks the selected elements for copying to another document or another location in the current document. Selected elements are shaded orange. See Copy and Paste. |
| Paste | Works as a typical Paste command for text. For selections of the diagram that have previously been selected for Copy, duplicates the copied elements into the currently selected group, or the top level of the diagram if there is no selection. For selections of the diagram that have previously been selected for Cut, moves the cut elements into the currently selected group, or the top level of the diagram if there is no selection. See Copy and Paste. |
| Delete | Deletes the current selection. |
| Select All | Selects all visible elements in the diagram. Does not select, for example, elements within collapsed groups or elements outside any currently hoisted group. |
| Deselect | Deselects all currently selected elements. |
| Select Successors | For each edge, entity, or junctor in the current selection, add to the selection each directly succeeding element. |
| Select All Successors | For each edge, entity, or junctor in the current selection, add to the selection every succeeding element. Useful for determining which elements can be affected “downstream” of one or more selected elements. |
| Select Predecessors | For each edge, entity, or junctor in the current selection, add to the selection each directly preceding element. |
| Select All Predecessors | For each edge, entity, or junctor in the current selection, add to the selection every preceding element. Useful for determining which elements can be affected “upstream” of one or more selected elements. |
| Select Head Entity | Selects the entity at the head of the currently selected edge. Useful for navigating diagrams with long edges. |
| Select Tail Entity | Selects the entity at the tail of the currently selected edge. Useful for navigating diagrams with long edges. |
| Select Paths Between Entities | Starting with two entities selected, find and select all the paths that connect them. |
| Reverse Selected Edges | Reverses the currently selected edges. See Reversing Edges. |
| Swap Selected Forward and Back Edges | Exchanges the positions of a single selected forward and back edge pair. See Swapping Forward and Back Edges. |
| Swap Selected Elements | Exchanges the positions of any two selected elements of the same kind. See Swapping Elements. |
| Preferences... | Displays the Preferences dialog. (Windows and Linux only. Preferences is located in the Flying Logic menu on the Mac.) |
| Find... | Displays the Find dialog. This dialog can also be displayed by clicking the Find button in the toolbar. |
Run Script Submenu
| Open Script... | Executes the selected general purpose script. For convenience, the submenu also remembers the last four scripts run this way. |
| Show Console | Displays the scripting system console. Messages output by running scripts will appear in this window. |
Entity Menu
| New Entity | Creates a new entity of the class selected in the Domain Inspector. See Working With Entities. |
| Insert Entity | Creates a new entity of the class selected in the Domain Inspector and inserts it along the currently selected edge. See Working With Entities. |
| Add Entity as Successor | When turned on, newly created entities will be automatically added as successors to a currently selected entity. When turned off, the new entities will be added as a predecessor. See Working With Entities. |
| New Entities from List on Clipboard | If you have placed text on the clipboard in the format of a list of entity titles, you can select the item to create new entries each with titled from the list and of the class selected in the Domain Inspector. |
| Reset Confidence | Resets all confidence values in the entire document to 50%. Useful for restarting demonstrations where all confidence values are expected to begin at 50%. |
| Renumber Entity IDs | Assigns a new Entity ID to all entities in the order they appear in the flow of the document. This is the only command that can change the Entity IDs in the document. See Annotation Numbers and Entity IDs. |
| Redact Selection | Changes all title and annotation text in the selected elements to X’s. This can be useful to remove sensitive information from a document before passing it to other parties for review. |
| Redact All | Changes all title and annotation text in the current document to X’s. If you need to pass a copy of a document to the Flying Logic developers so we can see how a particular layout behaves, you can use this command to remove all sensitive information from the document first. |
| Manage Custom Symbols... | Displays the Manage Custom Symbols dialog, which allows you to review, add, or delete custom symbols from the document. See Managing Custom Symbols. |
Redaction doesn't simply hide the redacted data in the document, it actually replaces it. Make sure to save an un-redacted version of the document for your own use.
Group Menu
| New Group | Creates a new group that encloses the currently selected elements. See Creating Groups. |
| Collapse Selected Groups | Collapse every selected group, but not any groups they themselves enclose. See Collapsing and Expanding Groups. |
| Deep-Collapse Selected Groups | Collapse every selected group, including any groups they themselves enclose. See Collapsing and Expanding Groups. |
| Expand Selected Groups | Expand every selected group, but not any groups they themselves enclose. See Collapsing and Expanding Groups. |
| Deep-Expand Selected Groups | Expand every selected group, including any groups they themselves enclose. See Collapsing and Expanding Groups. |
| Group Color | Changes the color of the selected groups to the choice from the submenu. See Group Colors. |
| Hoist Selected Group | Temporarily hides all document elements outside of the currently selected group. See Hoisting. |
| Unhoist One Level | Unhides all document elements in the group enclosing the currently hoisted group. See Hoisting. |
| Unhoist to Top | Unhides all document elements previously hidden by the other hoist commands. See Hoisting. |
View Menu
| Switch to Chart View / Switch to Graph View | Changes the view of the document window from Graph to Chart and back. See Chart View. |
| Confidence | Displays or hides the Confidence Spinners. See Confidence Spinners. |
| Edge Weights | Displays or hides the Edge Weights. See Edge Weights. |
| Edge Annotations | When turned on, every edge in the diagram will display a yellow box containing the text of the edge annotation instead of the small yellow bullet. Turning this option on supersedes the per-edge display of edge annotations. When turned on, even edges that have no annotation text will display a small yellow empty box where new text can be entered. When turned off, only edges that have the per-edge display of their annotation will display the box— others edges with annotations will display the yellow bullet. See Annotations. |
| Annotation Numbers | Displays or hides the Annotation Numbers. See Annotation Numbers and Entity IDs. |
| Entity IDs | Displays or hides the Entity IDs. See Annotation Numbers and Entity IDs. |
| Incremental Layout | Turns on or off incremental layout mode. See Incremental Layout. |
| Project Management | Displays or hides project management attributes throughout the document. See Project Management. |
| Element Text Attributes... | Displays the Element Text Attributes dialog. See Element Text Attributes. |
| Reveal Selection | Scrolls the currently-selected elements of the diagram into view, if they are not already visible. |
| Zoom to Fit | Adjusts the magnification to display the entire diagram. |
| Full Size | Adjusts the magnification to display the diagram elements at their full size. |
| Zoom In | Adjusts the magnification to display the diagram elements at their next largest size. |
| Zoom Out | Adjusts the magnification to display the diagram elements at their next smallest size. |
| Zoom X% | Adjusts the magnification to display the diagram elements at X% of their normal size. |
Domain Menu
| New Domain | Creates a new domain in the Domain Inspector. See Creating A Custom Class. |
| Duplicate Domain | Duplicates the currently-selected domain in the Domain Inspector. |
| Delete Domain | Deletes the currently selected domain, including all classes within the domain. All entities assigned to deleted classes are reassigned to the Generic class. |
| New Class | Creates a new custom class within the selected domain. See Creating A Custom Class. |
| Duplicate Class | Duplicates the currently-selected class in the Domain Inspector. |
| Delete Class | Deletes the currently selected class. All entities assigned to the deleted class are reassigned to the Generic class. |
| Import Domain | Prompts the user for a domain file to import, then adds the domain and its classes to the current document. See Exporting and Importing Domains. A shortcut to create a new document with a domain pre-imported is to simply open the exported domain file using the FileOpen command or double-click the exported domain file in your desktop environment. |
| Export Selected Domain | Prompts the user for the name and location of a domain file to save, and then writes the domain selected in the Domain Inspector, along with all its classes to the file. See Exporting and Importing Domains. |
| Save Domains as Defaults | After confirmation, saves the currently visible domains as the default set of visible domains for any newly created documents. Also allows restoring the default set of visible domains. |
| Domain Visibility | Enables any of the built-in domains to be hidden (or re-shown). |
Format Menu
| Font | Contains formatting options for fonts within annotation text. See Styled Text, Hyperlinks, and Browse Lock. |
| Make Plain Text | Removes all formatting from the selected annotation text. See See Styled Text, Hyperlinks, and Browse Lock. |
| Edit Hyperlink | Displays the Hyperlink Properties dialog for the currently selected annotation text. See See Styled Text, Hyperlinks, and Browse Lock. |
Window Menu
| Inspectors | Contains commands and keyboard shortcuts to display or hide each of the inspectors. See The Sidebar and Inspectors. |
| Hide Sidebar | Hides or displays the sidebar for times when a more presentation-oriented window format is desired. |
| Hide Toolbar | Hides or displays the toolbar for times when a more presentation-oriented window format is desired. |
| Toggle Focus Between Sidebar and Canvas | Changes whether the next keystrokes (such as arrow-key navigation) will be received by the sidebar or the canvas. |
| List of Open Documents | The Window menu also contains a list of currently open documents. The window for an open document may be brought to the front by selecting its name in this menu. |
Help Menu
| License Status... | This dialog is used for managing your registration information, including your subscription login status license key. |
| Edit Your Profile... | When logged in with a subscriber email address, this will open a web page that will let you change your contact or billing information. |
| Documentation | The items in this submenu open the Flying Logic User Guide (this document), Welcome to Flying Logic, Thinking With Flying Logic or the Flying Logic Scripting Guide in your web browser. |
| View License Agreement... | Displays a dialog containing the Flying Logic License Agreement. |
| View Credits... | Displays a dialog containing credits for Flying Logic. |
| Visit Flying Logic Web Site | Opens FlyingLogic.com in your web browser, where you can find support for Flying Logic as well as an active community of Flying Logic users. |
| Check for Updates | Uses your Internet connection to determine whether an updated version of Flying Logic is available for download. |
⌨Keyboard Shortcuts
All of Flying Logic keyboard shortcuts.
Platform Symbols
🅼 Mac
🆆 Windows
🅻 Linux
Modifier Keys
| Symbol | 🆆 🅻 | 🅼 |
|---|---|---|
| ⌥ | Alt | Opt |
| ⌃/⌘ | Ctrl | Cmd |
| ⌫ | Delete/Backspace | Delete/Backspace |
| ⇧ | Shift | Shift |
| ⎋ | Esc | Esc |
| ⇥ | Tab | Tab |
Keyboard Shortcuts
| Key | Normal | ⌃/⌘ | ⌥ | ⌃/⌘ + ⇧ | ⌃/⌘ + ⌥ | ⌃/⌘ + ⌥ + ⇧ |
|---|---|---|---|---|---|---|
A | Select All | View Annotations | ||||
B | Bold | |||||
C | Copy | View Confidence | New Class | |||
D | Deselect | View Edge Weights | 🅻 Show Desktop | |||
E | QuickCapture | New Entity | Add Entity as Successor | Insert Entity | ||
F | 0% confidence (False) | Find | ||||
G | New Group | |||||
H | 🅼 Hide App | Hoist Selected Group | 🅼 Hide Other Apps | |||
I | Italic | Togggle Incremental Layout | ||||
L | Hide Sidebar | 🅻 Lock Desktop | ||||
M | 🅼 Minimize App | View Project Management | ||||
N | New Document | View Annotation Numbers | ||||
O | Open | New Domain | ||||
P | Export as PDF | Select Predecessors | Select All Predecessors | |||
Q | 🅼 Quit | |||||
R | Reset Confidence | Reveal Selection | ||||
S | Save | Save As | Select Successors | Select All Successors | ||
T | 100% confidence (True) | Show Fonts | Toggle Focus | |||
U | 50% confidence (Unknown) | Underline | Unhoist to Top | Unhoist One Level | ||
V | Paste | Switch to Chart/Graph View | New Entities from List on Clipboard | |||
W | Close Tab | Close Window | Swap Elements | |||
X | Cut | |||||
Y | Redo | |||||
Z | Zoom-up an entity or edge annotation | Undo | Redo | |||
| ⌫ | Delete / Delete group, promote contents | Delete / Delete group and contents | ||||
, | Preferences | Zoom to Fit | ||||
. | Full Size | |||||
[ | Collapse | Deep collapse | ||||
] | Expand | Deep expand | ||||
< | Zoom In | |||||
> | Zoom Out | |||||
0 | 0% confidence/weight | |||||
1 | 10% confidence/weight | Document Inspector | ||||
2 | 20% confidence/weight | Domain Inspector | ||||
3 | 30% confidence/weight | Navigation Inspector | ||||
4 | 40% confidence/weight | Layout Inspector | ||||
5 | 50% confidence/weight | Operators Inspector | ||||
6 | 60% confidence/weight | Element Inspector | ||||
7 | 70% confidence/weight | Text Inspector | ||||
8 | 80% confidence/weight | User-Defined Attributes Inspector | ||||
9 | 90% confidence/weight | |||||
| ⇥ | Reduce selection/Edit | 🅼 Switch applications 🆆 Switch windows | 🅻 Switch panels | |||
| ⎋ | Clear copyset | 🅻 Processes | 🅻 Kill window | |||
+ | 100% weight | 🅻 Change resolution | ||||
- | -100% weight | 🅻 Change resolution | ||||
/ | Select Head Entity | |||||
\ | Select Tail Entity | |||||
| ↑←↓→ | Move selection | 🆆 Scroll Canvas | 🅼 Scroll Canvas | 🅻 Switch Workspace | ||
| LMB | Select/Move edge | 🆆 Select or multiselect (⇧ on 🅼) | Marquee Selection | 🅻 Move window | ||
| F4 | 🆆 Close app | |||||
| F(N) | 🅻 Change Terminal |
Preferences
Descriptions of all of Flying Logic's user preferences.
The Preferences dialog is displayed using the Edit ➡ Preferences... (Win) or Flying Logic ➡ Preferences (Mac) command.
General Options
Auto-Backup on Save
The Auto-Backup on Save checkbox determines whether a backup file of the last saved version is created each time an existing document is re-saved.
Enable Auto-Recovery
When enabled (default) Flying Logic will restore unsaved changes whenever it restarts. You are also able to quit Flying Logic without being asked to save changes to existing documents.
Auto-Recovery is not a substitute for regularly saving and backing up your work: you are responsible for making sure you avoid unintended data loss.
Opening Files
Flying Logic can open documents in their own window, as a tab in the current active window, or ask how to open each document.
Check for Updates Automatically
When selected, Flying Logic will periodically use your Internet connection to check whether an updated version is available for download.
Undo Levels
Flying Logic keeps track of the number of undo levels entered into this box. The default is 100.
Recent Documents
Flying Logic keeps track of this number of recently opened documents in File ➡ Open Recent. The default is 20.
Recent Scripts
Flying Logic keeps track of this number of recently run scripts (Max Scripts), importer scripts (Max Importers), and exporter scripts (Max Exporters). The default is 4.
Auto-Edit New Entity Titles
By default Flying Logic requires you to press Tab after creating an entity in order to edit its title. But since editing an entity’s title immediately after creating it is such a common operation, you can make it the default behavior by turning on this option.
Disable Control-Alt Menu Shortcuts
(Windows Only) Some international keyboard layouts require the Control-Alt modifier combination for typing. In this case, setting this preference causes Flying Logic to not use this modifier combination for its menu shortcuts.
Display Options
Each time the diagram changes, an animated transition is shown between the old state and new state. Several aspects of this transition are controllable via preferences.
Fixed-Speed vs. Adaptive Speed
If the Adaptive Animation box is unchecked, each transition will take a fixed amount of time controlled by the Animation Speed (Seconds) slider. If the Adaptive Animation box is checked, each transition will take an amount of time determined from the “visual complexity” of the animation. With adaptive animation, simple changes to the diagram result in quick animations, while complex animations with many objects moving result in slower animations that allow the eye to better track the changes. With adaptive animation, the Speed slider can still be used to control whether the animations happen faster or slower.
Turning Off the Animation
If the Adaptive Animation box is unchecked and animation speed is set to zero seconds, the animation does not take place, and layout changes to the diagram appear instantly.
Animation Style
The animation style radio buttons control how Flying Logic chooses which frames of the animation to generate. If Fixed Frame Rate is selected, then Flying Logic will choose a number of frames over which to perform the animation based on the animation speed (at a nominal 30 frames-per-second) and will draw every one of those frames. This option may look better on slower hardware. The preferred, default style is Fixed Time, where Flying Logic dynamically chooses which frames to draw based on the amount of time the last frame took to draw. This results in animations running at what often feels like a steadier pace, and is particularly suitable to faster hardware. Try both options and keep the one that feels best to you.
Edge Colors
The color of edges in your diagrams depends on this setting. The default is Red..Gray..Black, which means that edges with negative weights are drawn in red, edges with neutral settings are drawn in gray, and edges with positive weights are drawn in black.
| Option | Negative Weights | Neutral Weights | Positive Weights |
|---|---|---|---|
| Red..Gray..Black | Red | Gray | Black |
| Red..Yellow..Black | Red | Yellow | Black |
| Red..Yellow..Green | Red | Yellow | Green |
Spinner Display
Spinners always display a mini-pie chart of a percentage. The Spinner Display preference determines what symbols are drawn inside of spinners on top of the pie chart. The options are:
| Option | Confidence Spinner | Edge Weight Spinner | % Complete Spinner |
|---|---|---|---|
| None | nothing | nothing | nothing |
| Symbol | 0%: F 100%: T other: nothing | -100%..-1%: – 0%: O 1%..100%: + | 0%..99%: nothing 100%: C |
| Numeric | 0..100 | -100..100 | 0..100 |
Default Orientation, Bias, and Compactness
The Default Orientation, Default Bias, and Default Compactness settings control the orientation (flow direction), bias, and compactness of newly-created documents. Any document can have these settings changed using the Layout Inspector. For more information see Layout.
Project Options
These preferences apply only when Project Management is enabled.
Default Standard Calendar
This setting determines the number or work hours in a day for the Standard calendar of any newly-created document or documents that were created in Flying Logic 1 or 2.
Project Management
Flying Logic's built-in project management features.
A Work in Progress
Flying Logic 2.0 introduced experimental support for Project Management features, which have been expanded in later versions. Currently, we only support a subset of features necessary for Flying Logic to replace a fully-featured package such as Microsoft Project™, OmniPlan™ or Concerto.
Features Currently Supported
- Set project start date (S2F) or end date (F2S)
- Rudimentary support for project calendar (weekdays)
- Weekday exceptions calendar
- Task effort (days, hours, or minutes)
- Per-task start and finish dates, calculated or assigned
- Task percent complete
- Milestones
- Finish-to-start (F2S) task dependencies
- Rolling up start/finish date summaries to groups
- Scheduling granularities other than days (minutes, hours)
- Creating and assigning resources to tasks
- Gantt charts
- Resource calendars
- Import and Export to Microsoft Project and other project management applications.
- Export to Realization's Concerto (experimental).
Features Not Yet Supported
- Start-to-start (S2S), start-to-finish (S2F), and finish-to finish (F2F) task dependencies
- Lead and lag time on task dependencies
- Work Breakdown Structure (WBS) coding
- Resource leveling
- Full support for project calendar
- Costing and budgeting
Enabling Project Management
Using Flying Logic for project management is as simple as creating a new document and then clicking the Project Management icon in the Toolbar, or selecting View ➡ Project Management. Turning on Project Management changes the appearance of entities in the canvas and several inspectors, which are described in detail in the following sections:
- Entities gain labels for Start Date, Finish Date, Effort, and spinners for Percentage Complete.
- The Document Inspector gains a new Project Management tab.
- The Entity tab of the Element inspector contains fields for Start Date, Finish Date, Effort, Percentage Complete, Resources, and Resource Assignment.
.png)
- When creating a custom entity class, there is an option to have entities of the class be a milestone by default; i.e., a task with zero effort.
Project Settings
The Project Management tab of the Document Inspector is where you set up your general project attributes.
.png)
The Start Date and Finish Date fields specify the start date (or finish date) for all non-dependent tasks with no specifically assigned start (or finish) date. The arrow button between the fields determines whether the project is scheduled from the start date or the finish date. When scheduling from the start date the Finish Date field is not editable, and when scheduling from the finish date the Start Date field is not editable.
If a project does not start at the beginning of the Start Date or ends before the end of the Finish Date, a “clock” indicator will appear to the right of the date. If the date is currently editable, then the indicator will also act as a button. When pressed, the project will be reset to either start at the beginning of the day or finish at the end the day.
.png)
Each document has a standard work calendar. The settings for this calendar can be edited via the following controls.
.png)
The Workdays check boxes determine which weekdays will be considered work days for the purposes of date calculations.
The Hours control can be used to set the number of hours in a workday. This affects the meaning a day has when it appears in the effort control in the Element inspector’s Entity tab. Any hour amount greater than or equal to one day will be converted to an amount that includes a day amount; e.g., if the Standard calendar has an 8 hour workday, then an effort of 20 hours is displayed as “2 days, 4 hours.”
The Resources... button opens the Resources dialog that allows the creation of named resources that can be assigned to perform tasks associated with entities. The dialog can also be used to edit and remove resources.
.png)
Resource names must be unique within their document, although abbreviations do not have to be unique. Newly added resources start with a units of 100% and use the Standard calendar, but either of these can be changed.
Units indicates a percentage of the hours per workday assigned to the resource based on the calendar. This is an alternate way to indicate a resource works less hours per day instead of creating a new calendar.
The Calendars... button opens the Calendars dialog that allows for the editing, adding and removing alternate calendars. These alternate calendars can then be assigned to resources.
To edit a calendar select it from the combo box. The Standard calendar is also included in this list for convenience.
When creating a calendar you will be asked to provide a name and indicate which existing calendar the new calendar is based upon. Each calendar much have a unique name. In addition to any existing calendar, the new calendar can also be based on the Document Default calendar as set in Project preferences.
The Exceptions... button opens the Weekday Exceptions Calendar, where you can specify exceptions to the regular work week (holidays.)
.png)
When you turn Project Management on for a document for the first time, additional information to support project management is added to it. The Remove All Project Management Info button is used to remove all project management information from the document and turns Project Management off. You will only rarely need to use this feature. If you simply want to hide project management information without removing it from the document, just select View ➡ Project Management again.
The Project Management Domain
Flying Logic does not have a built-in domain for Project Management, but a custom domain is available as an example. Select the File ➡ Open Examples… menu item, select the Domains tab in the Open Example dialog, and double-click the Project Management folder to find Project Management.xlogic-d. Double-click on this domain to add it to the current document or create a new document that includes this domain. This domain has five entity classes:
- Milestone (a class with a default effort of zero days)
- Fixed-Effort (Work) Task (default resource assignment of Fixed Effort and effort of one day)
- Fixed-Duration Task (default resource assignment of Fixed Duration and effort of one day)
- Fixed-Units Task (default resource assignment of Fixed Units and effort of one day)
- Task (same as Fixed-Effort Task, included for compatibility with Flying Logic 2)
If you are only going to used the Project Management domain in a document, consider hiding the built-in domains (see Hiding Domains).
Entities as Tasks
Flying Logic entities are used to represent tasks and milestones. Tasks with non-zero effort show Start Dates, Finish Dates, and Percentage Complete spinners, while tasks with zero effort only display a Finish Date. Start or Finish dates which have been specifically assigned in the Entity tab of the Element Inspector are displayed in bold.
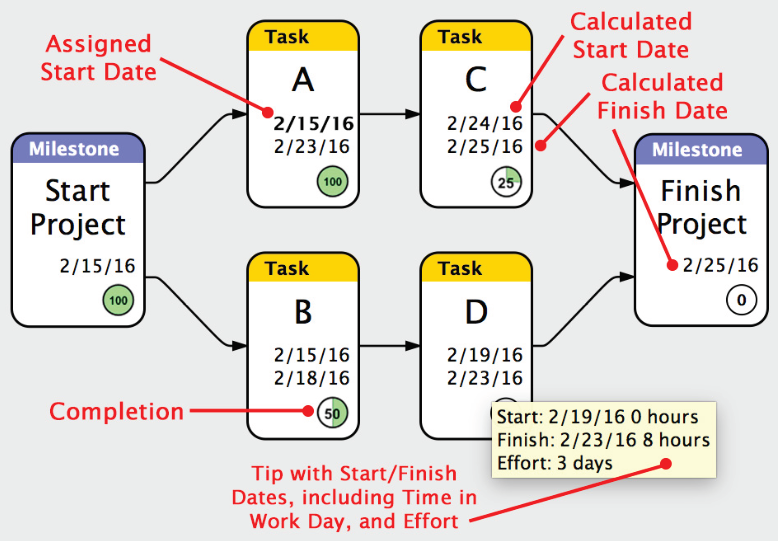
Merely setting a task’s effort to zero will not change it to the Milestone class, nor will setting a task’s effort non-zero change it to the Task class: you must assign classes yourself based on your intent for the entity.
Effort vs. Duration
The duration of a task, that is, how much calendar time it will take to complete, is determined by the amount of effort the task requires (also called work in some project management apps), the resources performing the task, and what calendar the resource will be working on. The duration of tasks is determined by the task’s effort (in days, hours, or minutes) and which weekdays are marked as workdays in the Project Management tab of the Document Inspector. For example, if you assign a task an effort of 2 days, the start date of the task is a Friday, and only Monday through Friday are counted as work days, then the duration of the task is 4 days, with that Friday and the following Monday being the 2 days of effort required, and the intervening Saturday and Sunday counting towards the task’s duration, but not its effort.
Each task’s effort is set in the Entity tab of the Element Inspector. A task’s duration is always the difference between its Start Date and Finish Date.
Calculated Dates vs. Assigned Dates
By default a task’s Start Date is based on the latest Finish Date of all its predecessor tasks (or the project Start Date if it has no predecessors), and its Finish Date is based on the task’s effort spread over the necessary number of calendar days, skipping non-work days.
By default, all the dates in a project except for its start date are calculated. But there are times when you need to constrain a task to start or finish on a given date. You can do this by entering a specific date in the Start Date, or Finish Date fields of the Element Inspector’s Entity tab. When a start date or end date has been specifically assigned, it appears in bold in the inspector and in the canvas element.
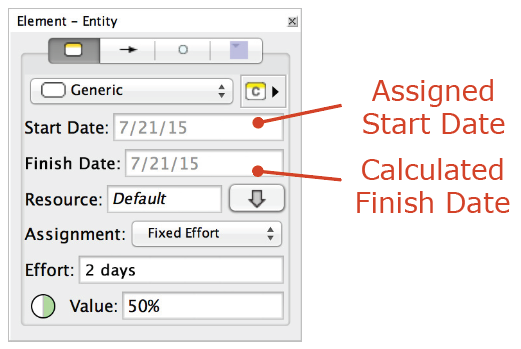
Entering Effort Values
The effort value can be changed by entering a new amount given in days, hours, and minutes optionally separated by commas. You can abbreviate day or days as d, hour or hours as h, and minute or minutes as m.
| 1 day | ||||
| 2 days | 2 day | 2d | ||
| 1 day, 4 hours | 1 day, 4h | 1 d 4 h | 1.5d | 12h |
A “day” is equal to the number of hours in the Standard calendar. Given an 8 hour work day, for each row above, all the effort values in it are equivalent.
The Resources drop-down menu can change which resources are assigned to a task. To clear all assigned resources from a task, choose the Default item.
The Assignment list can be used to change how multiple resources are applied to a task. This is only recalculated when resources are added to or removed from a task.
The Fixed Effort (also called Fixed Work in some project management apps) setting divides the current effort across all the resources, which reduces the duration of the task as more resources are added. For example, a task with one resource and an effort of 4 days would have a duration of 4 days. If you add a new identical resource to that task, the total effort will stay the same, 4 days; but the total duration will be halved to 2 days.
As new resources are added or removed, the Fixed Duration setting makes sure that each resource is assigned the same effort as the existing resources. For example, a task with one resource and an effort of 4 days would have a duration of 4 days. If you add a new identical resource to that task, the total effort will increase to 8 days, and the total duration will stay the same.
Finally, in the Fixed Units (also called Fixed Effort and Duration in some project management apps) setting, each resource only uses part of their time on the task. All other things being equal, two resources will have 50% units, three resources will have 33.3% units, etc. For example, a task with one resource (at 100% unit capacity) and an effort of 4 days would have a duration of 4 days. If you add a new identical resource to that task, the total effort and duration will stay the same, while both resources will be used at 50% unit capacity.
Percentage Complete
A task’s Percentage Complete can be adjusted from the Entity Inspector, or directly in the Canvas by manipulating the spinner.
Unlike Confidence spinners, which are calculated based on predecessor entities, Percentage Complete spinners are all independent. It is up to you to determine when each task or milestone is complete and mark it as such.
Project Management Features of Chart View
When Project Management is enabled, additional features appear in chart view.
.png)
The width and positioning of elements are changed to match the calculated schedule for tasks as indicated by the dates and days of the week that appear in the column header.
Project management specific values now appear in each row. The width of the Resources column can be changed just like the Title and Class columns.
A green completeness bar appears along the middle of entity elements with non-zero effort and completeness.
Edges as Dependencies
Edges between entities represent dependencies between tasks, with a successor task calculated to start after the latest Finish Date of all its predecessor tasks. This is known as finish-to-start (F2S) dependency, and is the most commonly found in project management. Other sorts of dependencies such as start-to-start (S2S) are also used, as is the practice of assigning a positive “lag” time or negative “lead” time to dependencies, however Flying Logic does not currently support these concepts.
Groups as Summaries
When Project Management is turned on, groups display the earliest Start date and latest Finish Date of all their enclosed tasks and subgroups.
.png)
Notes on MS Project Export and Import
When exporting a diagram to MS Project exchange format, Flying Logic performs the following conversions.
- Entities and junctors become tasks.
- Groups become summaries.
- Edges determine which tasks are considered predecessors of other tasks. All other attributes of edges are not exported.
- Entity and group titles, plus junctor names, become task names.
- Effort and Duration of entities are exported. Junctors are treated as Milestones with zero duration.
- Annotations for entities, junctors and groups become task notes.
- Text 1 or 30 field of the task is set to the element type (“Entity”, “Junctor” or “Group”) based on roundtrip export setting.
- Text 2 or 29 field of the task is set to entity class (entities only) based on roundtrip export setting.
- Text 3 or 28 field of the task is set to the user-defined attributes of the element based on roundtrip export setting.
- Number 1 or 20 field of the task is set to the confidence (entities and junctors only) based on roundtrip export setting.
- If project management is enabled, calendars and resources are exported.
- All tasks are marked as auto-scheduled. The exception is entities with a preferred start or finish date, which are marked as manually scheduled.
- Entities with a user-defined attribute named
ProjectGroupTaskare not exported but are used to modify the export of their direct parent group. See below for details.
When importing a diagram from MS Project exchange format, Flying Logic performs the following conversions.
- Tasks become entities unless the Text 1 or 30 field of the task is “Junctor” or “Group”.
- The user-defined attributes of the element are set to the Text 3 or 28 field of the task.
- The confidence of an entity are set the Number 1 or 20 field of the task.
- The entity class of entities is set to the Text 2 or 29 field of the task if the Text 1 or 30 field is “Entity”.
- In the case where no explicit entity class is assigned as above, the entity classes from the Project Management domain are assigned to entities based on the task attributes, if that domain exists in the document.
- Summaries become groups and may cause the generation of special entities (see below).
- Task notes become annotations.
- The user-defined attributes of the element are set to the Text 3 field of the task.
- The confidence of an entity are set the Number 1 field of the task.
- Calendars and resources are imported.
- If a task is manually-scheduled, the resulting entity is given a preferred start date.
Because MS Project summaries can have predecessors, but Flying Logic groups do not, some special rules are applied to allow for performing a round-trip of documents.
.png)
If a summary has a predecessor, the corresponding group will have a child entity with the same title as the group with * START appended (or just START if the group has no title) and a user-defined attribute named ProjectGroupTask with a value of start. This entity will have all the summary’s predecessors as predecessors. The entity itself is a milestone; i.e., have an effort of zero.
If a summary has a successor, the corresponding group will have a child entity with the same title as the group with * FINISH appended (or just FINISH if the group has no title) and a user-defined attribute named ProjectGroupTask with a value of finish. This entity will have all the summary’s successors as successors. The entity itself is a milestone.
Finally, if a summary is manually-scheduled, it will have a child entity with the same title as the group with * SUMMARY appended (or just SUMMARY if the group has no title) and a user-defined attribute named ProjectGroupTask with a value of summary. This entity will have the same effort and preferred start date as the summary.
During export, any entity in a group with a user-defined attribute named ProjectGroupTask will be used to modify the exported summary so it has the proper predecessors, successors and scheduling. These special entities are not exported.
You can create entities with the user-defined attribute ProjectGroupTask directly and have them apply similar modifications during export.
Notes on Concerto Export
Diagrams are exported as a JSON file that can then by imported into Concerto (see that product's documentation). Flying Logic performs the following conversions.
- Entities and junctors become tasks.
- Groups become summaries.
- Edges determine which tasks are considered predecessors of other tasks. All other attributes of edges are not exported.
- Entity and group titles, plus junctor names, become task names.
- Effort and Duration of entities are exported. Junctors are treated as milestones with zero duration.
- Annotations for entities, junctors and groups become task notes.
Flying Logic 4 Scripting Guide
Flying Logic implements a powerful internal scripting language. This guide contains all the details you need.
Colophon
© 2025 Arciem LLC
Flying Logic® is a Registered Trademark of Arciem LLC
API Version 1.12 for Flying Logic 4.0
This work is licensed under a Creative Commons Attribution-NonCommercial-ShareAlike 4.0 International License.
Getting Started
Flying Logic implements a powerful internal scripting language. Scripts can be used to create or manipulate documents and change Flying Logic’s application preferences. In addition, document importers and exporters can be written as scripts, including document transformation through Extensible Stylesheet Language Transformations (XSLT).
API Version
This edition of the Scripting Guide describes the Flying Logic Scripting API version 1.17. This is the API contained within Flying Logic 4.0.15 and later.
Scripting with Python
Flying Logic scripts are written in the Python™ programming language. This guide does not provide an extensive tutorial on Python, but only a quick overview for simple understanding of writing scripts. Online sources for information on Python or the specific implementation Flying Logic uses called Jython (Python for the Java Platform) can be found in Online Resources.
Python is an interpreted object-oriented program language. Small programs (called scripts) can be written and executed by Flying Logic via the Run Script, Import Via Script and Export Via Script menu items.
Simple scripts can be written without a knowledge of object-oriented programming, but complex scripts can benefit from such knowledge. Most of the variables that Flying Logic provided to scripts are objects, but can be manipulated fairly easily.
Here is a very simple script:
Application.alert("Hello, world!")
If you type the line above into a text file named hello.py and then select that file via the Run Script menu item, a dialog will appear with the message “Hello, world!” The .py part of the file name is the standard file extension for Python scripts.
Every Python script run via Flying Logic is provided a number of predefined variables. One of those is the Application object, which provides access to various features of the application that are not document-specific. The alert method of Application displays the string of text provided as a parameter to the method.
A second variable provided to all scripts is the document object. Here is a simple example of using this object:
Application.alert( document.title )
Create a script with the above line. In Flying Logic create a new document, open the Document Inspector and enter a value into the Title field. Use the Run Script command to execute the new script. A dialog should open with the “message” being the title you entered.
The document object gives you access to everything in the “current document”; i.e., the document that was active when you ran the script. The title instance variable of this document object gives access to the title field of the Document Inspector.
Many variables in the document (and Application) object can be read and written. If you run a script with the following line:
document.title = “A Simple Script Example”
you will find that the title field of the document has been changed.
Here is one more simple example that also demonstrates how to create conditional expressions, loops and blocks in Python and shows how to use the output console. Create a script with the following lines:
for ge in document.selection:
  if ge.isEntity:
    print ge.title
print "Done"
Python does not indicate the end of a statement with a semicolon or other delimiter like many other languages. Instead a newline indicates the end of a statement. The print element.title line is statement.
There are two looping statements in Python. The for loop executes a block once for each element in a sequence. A block in Python is indicated by indentation. The lines if ge.isEntity: and print ge.title are inside the for block, while print "Done" is not. The colon at the end of the for statement indicates the start of a block.
The selection variable of document returns a sequence containing objects representing all the selected graph elements in the document. The each loop of for block, the local variable ge is assigned one of the elements of selection.
The first line in the for block is a conditional if statement. If the condition is true, the conditional block is executed. The line print ge.title is inside the if statement’s block. (This also makes it a nested block.) If the variable isEntity of the ge object is true, then the title of the ge object (which must represent and entity in Flying Logic) will be printed.
You may be wondering where the print function prints text (or strings as they are called in Python). By default strings are printed to Flying Logic’s scripting console, which is a window that will open to display printed strings. This console will also appear when an exception occurs in the script and an error message is printed.
In summary, the above script prints the title of all selected entities to the console and then the string “Done”.
The Application and Document objects have many variables and methods that can be used to perform virtually every command in Flying Logic. The document object is an instance of the Document class. A script can retrieve objects representing other open documents other that the “current document” or even open or create new documents via the Application object. The Application object is a singleton: it is an instance of the Application class, but there is only ever one instance of that class. A complete class reference can be found in Predefined Variables and Classes.
About Jython and Java
Flying Logic uses the 2.7.0 version of Jython, which is compatible with the 2.7 command-line version of Python; i.e., CPython. Scripts have access to all features of a vanilla installation of Jython.
Scripts also have access to common Java modules that are distributed with Java SE Release 15 including java.base, java.datatransfer, java.desktop, java.management, java.prefs, java.sql, java.xml, and jdk.charsets Builds of Flying Logic on some platforms may have access to additional modules.
Example JSON Importer has an example of directly accessing Java to implement dialogs for an importer.
Calling sys.exit() in a script will actually terminate Flying Logic. Unless that is your desired result, avoid calling this function to exit a script!
Writing Importers and Exporters
Flying Logic document importers and exporters can be written in Python. The same pre-defined classes and variables exist for a regular script, but there are special functions and variables that a script must define to function as an importer or exporter.
An importer must define the function:
def importDocument(filename):
  """ code here """
This function is called to import the file with the given filename. If you are importing into the current document, you can use the pre-defined global variable document. To instead create a new document, call the method newDocument() in the Application object.
An importer must also define a global variable with the identifier importItemLabel. This is used to determine the label for the menu item that will be assigned to the importer script. For example:
importItemLabel = "Import Diagram from CSV File"
Optionally, an importer can define the function importSettings. This function has no parameters, should return True to continue execution, and is called before a file dialog is opened to allow the user to select an input file. One use of this function would be to ask for user to provide import settings information via a custom dialog.
def importSettings():
     global is_version_2
     result = request( 'Import file format?', ('Version 1', 'Version 2') )
     is_version _2 = (result == 1)
     return True
An exporter must define the function
def exportDocument(filename):
  """ code here """
and a global variable with the identifier exportItemLabel.
exportItemLabel = "Export Diagram to CSV File"
Optionally, an exporter can define the function exportSettings. This function has no parameters, should return True to continue execution, and is called before a file dialog is opened to allow the user to provide the name of an output file. One use of this function would be to ask for user to provide export settings information via a custom dialog.
def exportSettings():
     global as_version_2
     result = request( 'Export to which file format?', ('Version 1', 'Version 2') )
     as_version_2 = (result == 1)
     return True
For an exporter you will normally be working with the existing document object.
You can open, read and write files by using either the Python file functions supported by Jython or the standard file classes in Java SE.
For completeness, other scripts started by selecting the Run Script... menu item can be given a custom item name by assigning a string to runItemLabel.
Finally, an importer or exporter can define a global variable with the identifier defaultExtensions and assign a list of extensions as strings to it. For an exporter, the first element of the list is used to set the default output filename to the document’s filename with the given extension. For an importer, the list of extensions is used as a filter for allowed filenames. The value can be set from a provided importSettings or exportSettings function. For example,
defaultExtensions = [ ‘txt’, ‘csv’ ]
XSLT Importers and Exporters
Flying Logic’s Python interface can also be used to create importers and exporters that perform their functionality via Extensible Stylesheet Language Transformations (XSLT). XSLT is a language for transforming XML documents into other XML documents. The transformation is encoded in an XSLT input document, which is itself an XML document. These XSLT input documents can either be separate files or embedded in a Python script.
Since Flying Logic documents are in XML format, XSLT can be used to transform other document formats to and from Flying Logic. Performing this transformation does require that a XSLT input document author know the schema of the XML in a Flying Logic document. Instructions for downloading the complete XML Schema Definition (XSD) for Flying Logic documents can be found in Flying Logic Document Format, followed by additional information on how to interpret the schema.
Here is a short example of how to import a document using a string as the XSLT document:
xslt_string = """ some XSLT document as embedded string """
def importDocument(filename):
  Application.importDocument( filename, (Application.XSLT_STRING, xslt_string) )
More detailed example of an importer and exporter can be found in Importer and Exporter Examples.
Using Third-Party Python and Java Libraries
It is possible to access third-party Python and Java libraries from a script using the standard import feature of Python. To facilitate this, the global variable scriptParentDirectory is initialized with the path to the script’s location in the filesystem. A script can then be bundled with additional resources it requires, including libraries and other assets.
Use of a third-party Python library requires adding the path to the library to the Python import search path. This requires appending the library’s directory to sys.path.
import sys
sys.path.append(scriptParentDirectory)
import some_python_package
Use of a third-party Java library requires calling the Application method appendClassPath. The parameter to this method should be a list of either directories containing Java class files or paths to jar files.
Application.appendClassPath( [scriptParentDirectory + "SomeJavaLibrary.jar"] )
import some_java_package
Using third-party JDBC libraries to access databases requires the use of one of two special methods found in the Application class: createCompatibleDriver or createSQLConnection. See those methods for examples of usage.
Scripting Console
The print function in Python outputs a string to standard output. A Python program running in Flying Logic has its standard out redirected to the Scripting Console window. This window will appear whenever the print function is used.
.png)
A multi-line text area shows every string printed. For example the text area above shows the result of the statement
print "The author of current document:", document.author
assuming the author field in the Document inspector has been set to “Wolf”.
The text persists between execution of different scripts. Select the Clear Console button to erase the text. Select the Save Console button to save the text to a file.
If the Scripting Console is closed or hidden behind other windows, it can be made to appear by selecting the Show Console menu item.
Functionality Changes While Running a Script
There are some changes to Flying Logic’s functionality while a script is running.
- Layout of changes to a graph are deferred until the script completes.
- Auto-editing of new entity titles is disabled.
- All changes to a document are coalesced into one undo action (but see the
beginCoalesceUndomethod ofDocumentfor how to control this feature.) - Calculations of confidence values and project management dates are by default deferred until the script ends or
endCoalesceUndois called. If you need these calculations to occur mid-script, call the new document methodoperateAll. This method can be slow, so only call when absolutely necessary.
Exception Handling
Some scripting methods can return a Java exception instead of a Python exception. To handle these Java exceptions, you can import the class java.lang.Exception and then catch them.
from java.lang import Exception
# assume you have variables referencing an edge and a group
try:
  document.modifyAttribute([anEdge], "parent", anGroup)
catch Exception, e:
  print e.message
Alternately, you can import other Java exception classes if you want to handle exceptions caused by calling Java library code directly.
Uncaught exceptions will be printed to the Scripting Console. This includes uncaught Java exceptions, which prevents the Flying Logic’s normal exception report dialog from being displayed.
Online Resources
Important resources you should be familiar with to write scripts for use with Flying Logic.
Python™ Language and Jython
XSLT: Extensible Stylesheet Language Transformations
XSD: XML Schema Definition Language
Other Standards
Predefined Variables
These variables are defined for each script and are the primary access to Flying Logic documents and other features.
| Name | Description |
|---|---|
document | This represents the current document and is an instance of the Document class. |
Application | This is a singleton instance of the Application class. Methods and variables that are not related to particular documents can be accessed through this object. |
scriptParentDirectory | The path to the directory containing the script. |
scriptMode | Has the value importer, exporter or standard. This allows one script to act in any of the three modes; i.e., a script could be written as an importer and exporter. |
importItemLabelexportItemLabelrunItemLabel | These write-only variables will assign a custom name to the script’s menu item. See Writing Importers and Exporters for details. |
defaultExtensions | Optional list of extensions an importer or exporter expects for filenames. |
Classes
All the classes that Flying Logic exposes to scripts.
Overview
| Class | Description |
|---|---|
| Application | the Flying Logic application |
| CalendarEvent | an exception to the workweek |
| Color | an immutable RGB color value |
| Date | an immutable date |
| Document | an instance of a Flying Logic document |
| Domain | a domain |
| Edge | derived class of GraphElem for an edge |
| EntityClass | an entity class in a domain |
| Entity | derived class from VertexElem for an entity |
| FontSpec | a font specification |
| GraphElemFilter | base class for filters for creating a list of GraphElem |
| GraphElem | the base class of all graph element types |
| GraphOperator | base class for user-defined graph operators |
| Group | derived class from VertexElem for a group |
| Junctor | derived class from VertexElem for a junctor |
| LayoutLine | position information for one line of a title or annotation |
| Resource | a human, capital, or production resource |
| Symbol | a symbol |
| TextEditor | class representing a modifiable text field |
| Time | an immutable time |
| VertexElem | derived from GraphElem, base class for entity, junctor and group |
| VertexOperator | base class for system-defined operators |
| Workweek | a workweek for a resource |
Application
The Application class represents those features of Flying Logic that are independent of any particular document. Such features include application preferences, document loading and importing, version information, etc. In addition the Application class contains constants used in method calls in the Application class and others.
There is only one instance (singleton) of the Application class. This instance can be accessed by the global variable Application.
There are a number of enumerated types (orientation type, bias type, etc.) accessible from the Application instance. These are listed in their own section.
Fields
| Field | Type | Description |
|---|---|---|
version | string | Read only. The version of Flying Logic. |
apiVersion | string | Read only. The version of Flying Logic scripting API. See the Colophon for the current scripting API version. |
language | string | Read only. The user interface language of Flying Logic as a two-letter ISO 639 code possibly with a hyphen and country code appended to the end. |
vertexOperators | list of VertexOperator | Read only. A list of all available vertex operators. |
defaultOrientation | Orientation Type | The default orientation of new documents preference value. |
defaultBias | Bias Type | The default bias of new documents preference value. |
defaultGraphCompactness | Compactness Type | The default graph compactness of new documents preference value. |
animationSpeed | number | The animation speed preference value, between 0.0 and 1.0. |
adaptiveSpeed | number | The adaptive speed preference value, between 0.0 and 1.0. |
adaptiveAnimation | boolean | The adaptive animation state preference value. |
animationStyle | Animation Style Type | The animation style preference value. |
edgeColors | Edge Colors Type | The edge colors preference value. |
spinnerDisplay | Spinner Display Type | The spinner display preference value. |
undoLevels | integer | The maximum number of undo levels to retain preference value. |
autoBackupOnSave | boolean | The auto-backup on save preference value. |
autoRecoveryValue | boolean | The auto-recovery of files on launch preference. |
checkForUpdates | boolean | The check for updates preference value. |
useProxyServer | boolean | The use proxy server preference value. |
proxyServer | string | The proxy server preference value, either a domain name or an IP address. |
proxyPort | integer | The port of the proxy server preference value. |
maxRecentDocuments | integer | The maximum number of documents in Open Recent menu preference value. |
maxrecentScripts | integer | The maximum number of scripts listed in the Run Script sub-menu. |
maxrecentImports | integer | The maximum number of scripts listed in the Import Via Script sub-menu. |
maxrecentExports | integer | The maximum number of scripts listed in the Run Export Via Script sub-menu. |
autoEditNewEntityTitles | boolean | The auto edit entity titles preference value. |
canDisableControlAltShortcuts | boolean | The can disable ctrl-alt menu shortcuts preference value. Always returns False under MacOS and Linux. |
importPath | string | The directory that should be displayed in a file dialog involved in an import operation for the application. Defaults to the user’s home directory. |
lastAskDirectory | string | Read only. The directory the user chose during the last call to askForFile. |
entityFilter | GraphElemFilter | Read only. An instance of GraphElemFilter that only matches entities. |
junctorFilter | GraphElemFilter | Read only. An instance of GraphElemFilter that only matches junctors. |
groupFilter | GraphElemFilter | Read only. An instance of GraphElemFilter that only matches groups. |
edgeFilter | GraphElemFilter | Read only. An instance of GraphElemFilter that only matches edges. |
startFilter | GraphElemFilter | Read only. An instance of GraphElemFilter that only matches entities with no predecessors. |
endFilter | GraphElemFilter | Read only. An instance of GraphElemFilter that only matches entities with no successors. |
defaultDocumentPath | string | Read only. The default location for storing documents. |
defaultWorkHours | integer | The default work hours for a newly created Workweek instance including the standard calendar when project management is first enabled for a document. |
openDocumentOption | Open Document Option Type | The preferences for whether new documents should be opened in a window, tab, or the user always queried for the choice (when possible). |
Methods
newDocument()
Returns a Document instance representing a newly created Flying logic document.
openDocument( path )
Returns a Document instance representing the Flying Logic document opened from the given
path. If the document is already opened, this method just returns the existing Document instance.
findDocument( path )
Returns a Document instance representing the open Flying Logic document opened from the given
path, otherwise None is the document is not open.
importDocument( path, params )
Returns a Document instance representing a Flying Logic document created by importing the file with given
path(or by asking the user for a file if path isNone) using an XSLT file to transform the file into a Flying Logic document based on options in theparamsdictionary (see possible options under XSLT Import-Export Type).
showQuickCapture()
Displays the Quick Capture dialog.
exporterLabel( exportType )
Returns the label for the export menu item matching the given
exportType.
vertexOperatorByName( name )
Returns the VertexOperator with the given user interface
name; i.e., “Fuzzy And”.
filterGraphElemList(list, filter)
Given a
listof graph elements returns a new list that has been filtered by the given GraphElemFilterfilter.
alert( message )
Displays a simple alert dialog with a string
message.
requestForString( message, defaultValue )
Displays a simple dialog with
messagerequesting the user enter a value, which is returned as a string. The text input control in the dialog is pre-filled with thedefaultValue(the empty string andNoneare equivalent). If the user selects "OK" a string will always be returned, even if it is the empty string. If the user selects Cancel,Nonewill always be returned.
requestForPassword( label, defaultValue )
Displays a simple dialog with requesting the user enter a password, which is returned as a string. The
labelappears to the left of the password input control with the password displayed as bullet characters. The control is pre-filled with thedefaultValue(the empty string andNoneare equivalent). If the user selects "OK" a string will always be returned, even if it is the empty string. If the user selects Cancel,Nonewill always be returned.
requestForInteger( message, defaultValue )
Displays a simple dialog with
messagerequesting the user enter a value, which is returned as an integer. The text input control in the dialog is pre-filled with thedefaultValue, which must be an integer (orNone, which leaves the text input control empty). If the user selects "OK" an integer value is returned. If the user selects Cancel,Nonewill always be returned.
requestForDouble( message, defaultValue )
Displays a simple dialog with
messagerequesting the user enter a value, which is returned as a double. The text input control in the dialog is pre-filled with thedefaultValue, which must be an double (orNone, which leaves the text input control empty). If the user selects "OK" a double value is returned. If the user selects Cancel,Nonewill always be returned.
requestForOpenFile( defaultDirectory )
Displays a open file dialog requesting the user select a file. The dialog initially shows the files in
defaultDirectory, or the default user directory ifdefaultDirectoryisNone. If the user selects "OK" the path to the selected filename is returned as a string. If the user selects Cancel,Nonewill always be returned.
requestForSaveFile( defaultDirectory, defaultFile )
Displays a save file dialog requesting the user enter or select a file. The dialog initially shows the files in
defaultDirectoryor the default user directory ifdefaultDirectoryisNone. AdefaultFilecan be provided to set the selected file name, otherwise set toNone. If the user selects "OK" the path to the selected filename is returned as a string. If the user selects Cancel,Nonewill always be returned.
askForString( message, defaultValue )
Deprecated. Use
requestForString.
Displays a simple dialog withmessagerequesting the user enter a value, which is returned as a string. If the user selects Cancel, thedefaultValueis returned instead. The valueNoneis an acceptabledefaultValue.
askForPassword( label, defaultValue )
Deprecated. Use
requestForPassword.
Displays a simple dialog requesting the user enter a password, which is returned as a string. Thelabelappears to the left of the password input control with the password displayed as bullet characters. If the user selects Cancel, thedefaultValueis returned instead. The valueNoneis an acceptabledefaultValue.
askForInteger( message, defaultValue )
Deprecated. Use
requestForInteger.
Displays a simple dialog withmessagerequesting the user enter a value, which is returned as an integer. If the user selects Cancel, thedefaultValueis returned instead.
askForDouble( message, defaultValue )
Deprecated. Use
requestForDouble.
Displays a simple dialog withmessagerequesting the user enter a value, which is returned as a float (which is equivalent to a Java double). If the user selects Cancel, thedefaultValueis returned instead.
request( message, labels )
Displays a request dialog titled “Request” to the user to answer a question
messageby making a selection among a set of buttons withlabels(a tuple). Returns an integer matching the index of the label in the tuple. Note: themessagecan be a string or a Java Component object, allowing for the creation of a more complicated dialog.
request( title, message, labels )
Displays a request dialog with
titleto the user to answer a questionmessageby making a selection among a set of buttons withlabels(a tuple). Returns an integer matching the index of the label in the tuple. Note: the message can be a string or a Java Component object, allowing for the creation of a more complicated dialog.
askForFile( defaultDirectory, save )
Deprecated. Use
requestForOpenFileorrequestForSaveFileas appropriate.Displays a file dialog requesting the user select a file. The dialog is a save file dialog if
saveisTrue, else it’s an open file dialog. The dialog initially shows the files indefaultDirectoryor the default user directory ifNone. Returns the path to the selected file as astringorNoneif the user cancelled.
askForFile( save )
Deprecated. Use
requestForOpenFileorrequestForSaveFileas appropriate.Displays a file dialog just like the above method, but always initially shows the files in the default user directory.
appendClassPath( pathList )
Appends the paths in
pathListto the Java classpath for the script. The values in the list should be either directories containing Java class files or paths to jar files, as strings.
createCompatibleDriver( driver )
Returns a “compatible” instance of java.sql.Driver that acts as a shim class to another instance of java.sql.Driver created from a JDBC library. This is a workaround for a “feature” of Java where Driver instances can only be used if created by the application ClassLoader, which is not true of scripts running in Flying Logic.
# You should have previously added the path to the MySQL JDBC jar via Application.appendClassPath method
from com.mysql.jdbc import Driver
from java.sql import DriverManager

# Need to create shim Driver
shimDriver = Application.createCompatibleDriver( Driver() )
DriverManager.registerDriver(shimDriver);
conn = DriverManager.getConnection("jdbc:mysql://someserver/somedb", "someuser", "somepassword")
createSQLConnection(url, username, password, driverClassName)
Returns a Python SQL connection object. This method is a replacement for the the connect method in Jython’s zxJDBC package.
# You should have previously added the path to the MySQL JDBC jar via Application.appendClassPath method
url = "jdbc:mysql://someserver/somedb"
username = "someuser"
password = "somepassword"
driver = "com.mysql.jdbc.Driver"

# obtain a connection using the with-statment
#with zxJDBC.connect(jdbc_url, username, password, driver) as conn:
with Application.createSQLConnection(url, username, password, driver) as conn:
  with conn:
    with conn.cursor() as c:
      # execute SQL commands
CalendarEvent
A CalendarEvent stores a work schedule exception. Instances of CalendarEvent are immutable.
Fields
| Field | Type | Description |
|---|---|---|
startDate | Date | Read only. The date of the exception. |
Color
The Color class represents an RGB color value. Color instances are immutable. The constructors are accessible from scripts.
Fields
| Field | Type | Description |
|---|---|---|
r | number | Read only. The red component, as a value between 0.0 and 1.0. |
g | number | Read only. The green component, as a value between 0.0 and 1.0. |
b | number | Read only. The blue component, as a value between 0.0 and 1.0. |
a | number | Read only. The alpha component, as a value between 0.0 and 1.0. |
Methods
init( r, g, b )
Constructs a new Color instance with the given red, green and blue values (in the range 0.0 to 1.0) and an alpha of 1.0.
init( r, g, b, a )
Constructs a new Color instance with the given red, green, blue and alpha values (in the range 0.0 to 1.0).
init( name )
Constructs a new Color instance derived from standard HTML color hex value or color name; e.g., “#FF0000”, “white”, “black”, “orange”, etc. See Online Resources for a link to a complete list.
equals( object )
Returns True if object represents the same color as self within a set tolerance.
Pre-defined colors
These are class variables of Color. Note that some are not a match for the HTML color name equivalent; e.g., ORANGE is the not the same color as HTML “orange”.
| Name | r | g | b |
|---|---|---|---|
| BLACK | 0.00 | 0.00 | 0.00 |
| WHITE | 1.00 | 1.00 | 1.00 |
| RED | 1.00 | 0.00 | 0.00 |
| ORANGE | 1.00 | 0.50 | 0.00 |
| YELLOW | 1.00 | 1.00 | 0.00 |
| GREEN | 0.00 | 1.00 | 0.00 |
| BLUE | 0.00 | 0.00 | 1.00 |
| VIOLET | 1.00 | 0.00 | 0.50 |
| CYAN | 0.00 | 1.00 | 1.00 |
| MAGENTA | 1.00 | 0.00 | 1.00 |
| GRAY | 0.50 | 0.50 | 0.50 |
| LIGHT_GRAY | 0.75 | 0.75 | 0.75 |
| DARK_GRAY | 0.25 | 0.25 | 0.25 |
Date
The Date class represents a day of the year. Date instances are immutable. The constructors are accessible from scripts.
Fields
| Field | Type | Description |
|---|---|---|
daysFromSunday | integer | Read only. The day of the week as a difference from Sunday: 0 for Sunday, 1 for Monday, etc. |
Methods
init( )
Constructs a new Date instance for the current date.
init( year, month, day )
Constructs a new Date instance for the given
year,monthandday.
equals( object )
Returns
Trueif object represents the same date as self.
compareTo( date )
Returns 0 if the
daterepresented by the argument is equal to the date represented by this Date, less than 0 if the date of this Date is before the date represented by the argument, and greater than 0 if the date of this Calendar is after the date represented by the argument.
day( )
Returns the day, from 1 to 31.
month( )
Returns the month, from 0 to 11.
year( )
Returns the year.
weekday( )
Returns the day of the week, from 1 (Sunday) to 7 (Saturday), same as the constants in the Java Calendar class.
addDays( days )
Returns a new Date instance representing a date with the given number of
daysadded to the date represented by this Date. The argument days can be negative.
addDays( workdays, workweek )
Returns a new Date instance representing a date with the given number of
workdaysadded to the date represented by this Date and properly considering the Workweek represented by the parameterworkweek. The argumentworkdayscan be negative.
Document
The Document class represents a Flying Logic document. Every script has a global variable document that in an instance of Document representing the current document.
Fields
| Field | Type | Description |
|---|---|---|
title | string | The title of the document. |
author | string | The author of the document. |
comment | string | The comments of the document. |
keywords | string | The keywords of the document. |
edgeWeightsVisible | boolean | The edge weights visible setting. |
confidenceVisible | boolean | The confidence visible setting. |
annotationNumbersVisible | boolean | The annotation numbers visible setting. |
edgeAnnotationsVisible | boolean | The edge annotations visible setting. |
entityIDVisible | boolean | The entity ID visible setting. |
addEntityAsSuccessor | boolean | The add entity as successor setting. |
projectManagementVisible | boolean | The project management visible setting. |
layoutIncrementally | boolean | The layout incrementally setting. |
browseAnnotations | boolean | The browse annotations setting. |
printShowSelectionHalo | boolean | The show selection halo when printing setting. |
canvasView | Application.GRAPH_VIEW or Application.CHART_VIEW | The current kind of canvas view. |
startDate | Date or None | The start date of project when project management is enabled, otherwise None. This field is read-only if using finish-to-start scheduling, with the following exception: setting this variables to None disables project management. |
actualStartDate | Date | The start date of the earliest task, which may be earlier than project start date because of the task having a preferred start or finish date. Read only. |
finishDate | Date or None | The finish date of project as a Date instance when project management is enabled, otherwise None. The field is read-only if using finish-to-start scheduling, with the following exception: setting this variable to None disables project management. |
startTime | integer | Returns the number of hours into the work day that the project begins. |
finishTime | integer | Returns the number of hours into the work day that the project ends. |
standardCalendar | Workweek or None | The standard calendar is the Workweek instance uses for all tasks not assigned a resource when project management is enabled, otherwise None. Note that this variable always returns a deep copy, not the current instance. Modifications will not be saved unless you set the copy. For example: stdCalendar = document.standardCalendar; stdCalendar.workdays = Workweek.MONDAY_MASK ^ theWeek.workdays; document.standardCalendar = stdCalendar |
scheduleBasis | Application.SCHEDULE_FROM_START_DATE (default) or Application.SCHEDULE_FROM_END_DATE | The direction of project scheduling |
workweek | This field is deprecated. Use standardCalendar instead. | |
calendars | list of Workweek | A read-only list of all defined calendars. These are copies. To make permanent changes call the method updateCalendar. List may be empty. |
resources | list of Resource | A read-only list of all defined resources. These are copies. To make permanent changes call the method updateResource. List may be empty. |
leftHeader | string | The left header text. |
middleHeader | string | The middle header text. |
rightHeader | string | The right header text |
leftFooter | string | The left footer text |
middleFooter | string | The middle footer text |
rightFooter | string | The right footer text |
orientation | Orientation Type | The layout orientation of the graph. |
bias | Bias Type | The layout bias of the graph. |
graphCompactness | Compactness Type | The layout compactness of the graph. |
defaultEntityClass | EntityClass | The default entity class, usually Generic. Read only. |
selectedEntityClass | EntityClass | The current entity class of newly-created entities when not explicitly specified |
defaultJunctorOperator | VertexOperator | The current operator of newly-created junctors. |
entityOperator | VertexOperator | The current operator of newly-created entities. |
entityTitleWidth | number | The entity title width multiplier in range 1.0 to 8.0. |
entityTitleFont | FontSpec or None (default) | The document-wide entity title font. This FontSpec can have a size of FontSpec.AUTOSIZE. |
entityClassFont | FontSpec or None (default) | The document-wide entity class name font. |
groupTitleFont | FontSpec or None (default) | The document-wide group title font. |
defaultAnnotationFont | FontSpec or None (default) | The document-wide default annotation font. |
documentPath | string or None | Read only. The path to the file from which the document was loaded, or None if the document has never been saved. |
hoistedGroup | Group or None | The currently hoisted group. |
hasSelection | boolean | Read only. True if any elements in the graph are selected, otherwise False. |
selection | list of GraphElement | The current selection in the graph. |
all | list of GraphElement | The entire graph. |
orderedVertices | list of VertexElem | All vertices as a list, earliest predecessor first, in acyclic order; i.e., ignoring back edges. |
reverseOrderedVertices | list of VertexElem | All vertices as a list, latest successor first, in acyclic order; i.e., ignoring back edges. The reverseOrderedVertices list is not necessarily the reverse of the orderedVertices list because of how groups and unconnected entities are handled. |
domains | list of Domain | Read only. All the domains in the document. |
customSymbols | list of Symbol | Read only. All the custom Symbols in the document. |
pageSize | tuple (width, height) | Read only. The currently calculated page size when printing in points. |
exportPath | string | The directory that should be displayed in a file dialog involved in an export operation for this document, defaults to the user’s home directory. |
imageExportAttributes | dictionary | A dictionary with the current image export attributes (see Image Export Type) |
chartFrame | tuple (x, y, width, height) | Read only. The frame of the chart table. |
chartCornerFrame | tuple (x, y, width, height) | Read only. The frame of the “corner” of chart table where the headers reside. |
chartRowFrame | tuple (x, y, width, height) | Read only. The frame of the row header of chart table. |
chartColumnFrame | tuple (x, y, width, height) | Read only. The frame of the columns of data in the chart table. |
chartColumnLines | tuple | Read only. A tuple containing the x-position of all vertical lines in chart table. |
chartHeaderTitles | dictionary | Read only. A dictionary of the strings of the header labels. (See Chart Part Type). |
chartHeaderRects | dictionary | Read only. A dictionary of the frames of the header labels as tuples (x, y, width, height). (See Chart Part Type). |
zoomFraction | number | The current zoom value for the canvas. Values greater than 1.0 indicate the canvas is zoomed-in, values less than 1.0 indicate the canvas is zoomed-out. |
Methods
modifyAttribute( list, name, value )
Modify a particular built-in attribute
name(a string) tovaluefor every instance of GraphElem inlist, throwing an exception if any instance does not support the given name. The following attributes can be set with this method:
weightweightVisibleannotationVisibleoperatorentityClasssymbolcolorconfidencecompletionparentcollapseddeepCollapsed(This represents a pseudo-attribute that can deep collapse a group.)startDatefinishDate(Deprecated. UseendDatefinishDateinstead.)effortresourceThe attributes
titleandannotationcannot be set via this method.
modifyUserAttribute( list, name, value )
Modify a particular user defined attribute
nametovaluefor every instance of GraphElem inlist.
hoistGroupFromSelection( )
Hoists the first group found in the current selection. If there are more than one group in the selection, it is ambiguous which will be hoisted.
hoistGroupToParent( )
If a group is hoisted, its parent group is hoisted instead, otherwise does nothing.
isSelected( elem )
Returns
Trueif the GraphElem elem is selected, otherwiseFalse.
selectAll( )
Selects every element in the graph.
clearSelection( )
Deselects every element in the graph.
addEntity( )
Adds a new entity to the graph with class
defaultEntityClass. If only one entity is currently selected, the new entity is connected to that selected entity per the setting ofaddEntityAsSuccessor. Returns a list of new elements, Entity instance first.
addEntity( entityclass )
Adds a new entity to the graph with class
entityclass. If only one entity is currently selected, the new entity is connected to that selected entity per the setting ofaddEntityAsSuccessor. Returns a list of new elements, Entity instance first.
addEntityToTarget( vertexElem )
Adds a new entity to the graph with class
selectedEntityClass. The newly created entity is connected to the givenvertexElemper the setting ofaddEntityAsSuccessor. IfvertexElemis None, does not connect the new entity to any element. Returns a list of new elements, Entity instance first.
addEntityToTarget( entityclass, vertexElem )
Adds a new entity to the graph with class
entityclass. The newly created entity is connected to the givenvertexElemper the setting ofaddEntityAsSuccessor. IfvertexElemisNone, does not connect the new entity to any element. Returns a list of new elements, Entity instance first.
insertEntity( )
Inserts a new entity to the graph with class
selectedEntityClass, but only if a single edge is selected, otherwise an exception is thrown. Returns a list of new elements, Entity instance first.
insertEntity( entityclass )
Inserts a new entity to the graph with class
entityclass, but only if a single edge is selected, otherwise an exception is thrown. Returns a list of new elements, Entity instance first.
insertEntityOnEdge( edge )
Inserts a new entity to the graph with class
selectedEntityClasson the given edge. Throws an exception ifedgeisNone. Returns a list of new elements, Entity instance first.
insertEntityOnEdge( entityclass, edge )
Inserts a new entity to the graph with class
entityclasson the given edge. Throws an exception ifedgeisNone. Returns a list of new elements, Entity instance first.
getDomainByName( name )
Return the Domain instance with the given name or None.
getEntityClassByName( name_or_tuple )
Return the EntityClass instance based on one of two matching criteria: if
name_or_tupleis a string, then the parameter is the name of an entity class to find (preference is given to a custom entity class if the are duplicate names); otherwise, ifname_or_tupleis a tuple, then the parameter must be the tuple(domain_name, entity_class_name)identifying an entity class (see also the Domain class methodgetEntityClassByName.)Examples:
entityclass = document.getEntityClassByName('Goal')
entityclass = document.getEntityClassByName( ('Prerequisite Tree', 'Milestone' ) )
print( )
Prints a document after displaying the print preferences dialog.
print( ask )
Prints a document. Displays the print preferences dialog if
askisTrue.
focusCanvas( )
Changes the current keyboard focus to the graph canvas.
cut( )
Performs a cut operation on the selected elements in the graph.
copy( )
Performs a copy operation on the selected elements in the graph.
paste( )
Pastes the graph elements from the last, still active, copy operation to the document.
deleteSelection( recurse )
Deletes the currently selected graph elements. If
recurseisTrue, also deletes nested elements in selected groups.
newDomain( name )
Returns a new Domain instance with the given
name.
deleteDomain( domain )
Deletes the given
domain, automatically changing the class of any entity in the graph to defaultEntityClass if that entity’s class was part ofdomain.
deleteEntityClass ( entityclass )
Deletes the given entity class, automatically changing the class of any entity in the graph to defaultEntityClass if that entity’s class was
entityclass. This is same operation as:
entityclass.getDomain().deleteEntityClass(entityclass)
newGroup( )
Creates a new group containing all currently selected elements and returns a list of new elements, Group instance first.
newGroup( children )
Creates a new group containing all elements in children, which must be a list, and returns a list of new elements, Group instance first.
newSymbol( path, rect )
Creates a new symbol from the file at
pathclipped to therecttuple. IfpathisNone, the user is asked to select a file. IfpathorrectisNone, the Image Viewer dialog is shown. Therecttuple is (left, top, width, height).
newSymbolFromObject( obj, rect )
Creates a new symbol from
obj, whereobjcan either be an instance ofjava.awt.Image,javax.swing.ImageIconor a string of a SVG XML document, clipped to therecttuple. Therecttuple is (left, top, width, height).
deleteSymbol( symbol )
Deletes the symbol, fixing-up all entity classes and entities as needed.
isCustomSymbol( symbol )
Returns
Trueifsymbolis custom (not built-in).
connect( fromElem, toElem )
Connects an edge from the
fromElemto thetoElem, where the elements must be an entity, junctor or edge. Returns a list of new elements.
reconnect( edge, part, element )
Reconnects one end of
edgeto a new element, wherepartindicates which end (see Edge Part Type in Application class). Returns a list of new elements.
saveDocument( )
Saves the document, asking the user to select a file only if the document has never been saved.
saveDocumentAs( path )
Saves the document to the file at
path, creating the file if necessary. IfpathisNone, the user is asked to select a file.
saveDocumentAsTemplate( path )
Saves the document as a template to the file at
path, creating the file if necessary. IfpathisNone, the user is asked to select a file.
exportDocument( kind, path, params )
Exports a document to a file of
kindatpathwith settings in theparamsdictionary. IfpathisNone, the user is asked to select a file. Thekindis one of the Export Types in the Application class. The keys and values inparamsare export kind dependent (see Image Export Type, OPML ExportType, and XSLT Import-Export Type for possible keys and values).
importDocument( kind, path, params )
Imports a document from a file of
kindatpathwith settings in theparamsdictionary. IfpathisNone, the user is asked to select a file. Thekindis one of the Import Types. The keys and values inparamsare export kind dependent (only XSLT import used params, XSLT Import/Export Types for possible keys and values). Returns either a new Document instance, if the import creates a new document, or this Document if not.
createResource( )
Creates and returns a new Resource instance with default values. If you change the values you must call updateResource.
createResource( name, abbreviation, units, calendar )
Creates and returns a new Resource instance with the given values. The
nameandunitsparameters must not beNone, butabbreviationandcalendarcan. If a resource with name already exists, the value “Copy of” prepended to name is used. For a default units supply the value 1.0. If calendar isNone, the standard calendar is assigned to the new resource.
copyResource( resource )
Returns a copy of the given resource with name changed by prepending “Copy of”.
updateResource( resource )
Updates a Resource instance. Changes to resource instance do not take full effect until this method is called.
removeResource( resource )
Removes the given resource from the document.
resourceByName( name )
Return the Resource instance with the given name or None if these is no such resource.
createCalendar( )
Creates and returns a new Workweek instance with default values. If you change the values you must call
updateCalendar.
createCalendar( name, workdays, workhours )
Creates and returns a new Workweek instance with the given values. The
nameparameter must not beNone, If a calendar withnamealready exists, the value “Copy of” prepended to name is used. Theworkdaysparameter must be a combination of day and week values and cannot be zero. Theworkhoursparameter must be between 1.0 and 23.0.
copyCalendar( calendar )
Returns a copy of the given
calendarwith name changed by prepending “Copy of”.
updateCalendar( calendar )
Updates a Workweek instance. Changes to
calendarinstance do not take full effect until this method is called.
removeCalendar( calendar )
Removes the given
calendarfrom the document.
calendarByName( name )
Return the Workweek instance with the given
nameorNoneif these is no such calendar.
resetStartTime( )
Resets the project start time to the start of the work day. Only applies when finish-to-start scheduling is set.
resetFinishTime( )
Resets the project finish time to the end of the work day. Only applies when start-to-finish scheduling is set.
closeDocument( ask )
Closes the document, asking the user for permission if
askisTrueand the document has been modified.
find( match, options )
Finds all graph elements that correspond to
matchwith the givenoptions(see Find Types in Application class).
selectSuccessors( )
Selects the immediate successors of all current selected entities and junctors, including any edge in-between. This functionality is different than in previous API versions and is now found in the
selectAllSuccessorsmethod documented below.
selectAllSuccessors( )
Selects the successors of all current selected entities and junctors (and their successors) including any edge in-between each.
selectPredecessors( )
Selects the immediate predecessors of all current selected entities and junctors, including any edge in-between. This functionality is different than in previous API versions and is now found in the
selectAllPredecessorsmethod documented below.
selectAllPredecessors( )
Selects the predecessors of all current selected entities and junctors (and their predecessors) including any edge in-between each.
selectEdgeHeadEntity( )
Selects the head entity of all current selected edges, including any edge or junctor in-between.
selectEdgeTailEntity( )
Selects the head entity of all current selected edges, including any edge or junctor in-between.
selectPathsBetweenEntities( )
Selects all elements between two selected entities.
reverseSelectedEdges( )
The head and tail elements of edge selected edge are swapped.
swapSelectedElements( )
If the two selected elements are of the same type, swaps them.
swapSelectedForwardAndBackEdges( )
Swaps the selected forward and back edges.
redactSelection( )
Redact the selected elements.
redactAll( )
Redact all elements.
importDomain( path )
Imports the domain from the file at
path.
saveDomainsAsDefaults( )
Saves the current custom domains as the defaults for future new documents.
eraseProjectManagement( )
Erases all project management information from the document, the same affect as:
document.startData = None
isSymbolInUse( symbol )
Return
Trueif a symbol is being used by an EntityClass or Entity.
getSymbolByName( name )
Returns the a Symbol instance matching the given
name. Symbol names are a generator name and an ID code separated by a colon. For example, the blue pentagon symbol iscom.arciem.symbol.FlowchartSymbolGenerator:pentagon. If name is “inherit” or “none”, the predefined special symbol valuesApplication.INHERIT_SYMBOLandApplication.NO_SYMBOL, respectively. A table with the names of the builtin symbols can be found in Graphic Symbol Names.
undo( )
Perform an undo operation if possible.
redo( )
Perform a redo operation if possible.
beginCoalesceUndo( name )
Causes all changes to a document in a script to be coalesced into one undo record under the given
name. This is done internally for each document accessed by a script, but can still be called to change the undo record’s name. The methodendCoalesceUndois called internally when the script terminates.
endCoalesceUndo( )
Closes and appends the current undo record to the undo stack, but only if there is anything to undo. A new undo record is automatically started, but it’s name can be changed by calling
beginCoalesceUndo.
operateAll()
Immediately performs a re-calculation of driven confidence values and project management data. These re-calculations are normally deferred until the script ends or
endCoalesceUndois called as they can take a significant amount of time on large documents.
operate( operator, flags )
Operate on each element in a graph in acyclic order using
operator, an instance of a class derived from GraphOperator, with the types and order of elements determined byflags(see Operate Types in Application class.)
formatDate( date )
Returns a string representing the given
dateas formatted for a start or finish date.
calcFont( spec )
Calculates the ascent, descent and uppercaseHeight fields of the given FontSpec
specderived from the document environment.
getStringBounds( string, spec )
Calculates the bounds of the given
stringrendered with the given FontSpecspec. Returns a tuple (x, y, width, height).
truncateWithEllipsis(string, spec, width)
If the given
stringrendered the given FontSpecspecdoes not fit inwidth, returns the string truncated and an ellipsis added. Return the original string is it would fit.
findStaticFont( name )
Returns a FontSpec for the given UI usage
name, orNoneif no such font.
inHoist( elem )
Returns
Trueif the given GraphElemelemis in the current hoist; i.e., the current hoisted group is an ancestor of elem. Otherwise, returnsFalse.
Domain
The Domain class represents a domain, a named collection of entity classes, in a document.
Fields
| Field | Type | Description |
|---|---|---|
name | string | The domain’s name. |
builtIn | boolean | Read only. True if the domain is built-in and cannot be modified. |
hidden | boolean | True if hidden. |
entityClasses | list of EntityClass | Entity classes in the domain. |
Methods
getEntityClassByName( name )
Returns the entity class in the domain with name, as an EntityClass. Returns
Noneif there is no such class.
newEntityClass( )
Creates and returns a new entity class in the domain, as an EntityClass.
deleteEntityClass( entityclass )
Deletes the given EntityClass from the domain.
export( path )
Exports the domain to a the file at path, asking the user to select a file if path in
None.
duplicate( )
Returns a duplicate of the domain with the name modified to include “copy,” as a Domain.
Edge
Edge is derived class of GraphElem and represents an edge in the graph.
Fields
| Field | Type | Description |
|---|---|---|
isEdge | boolean | Read only. Returns True. |
weight | number | The edge weight, a float value normally between -1.0 and 1.0. |
weightVisible | boolean | True if the edge weight is visible independently of the document’s edgeWeightsVisible setting. |
annotationVisible | boolean | True if the edge annotation is visible independently of the document’s edgeAnnotationsVisible setting. |
source | GraphElem | Read only. The source element of the edge; i.e., the element at the tail-end of the edge. |
target | GraphElem | Read only. The target element of the edge; i.e., the element at the head-end of the edge. |
isBackEdge | boolean | Read only. True if the edge is a back edge. |
splines | Deprecated. Use splinesDictionary instead. | |
splinesDictionary | dictionary or None | Read only. The edge’s splines as a dictionary or None if the edge is hidden in a collapsed group. The keys are the The dictionary values are tuples of tuples of the spline control points. |
arrowheadVertices | tuple or None | Read only. The edge’s arrowhead as a tuple of three tuples (x, y) or None if the edge is hidden in a collapsed group. |
color | Color | The edge’s color in the canvas. |
noteLines | list of LayoutLine | Read only. A list of LayoutLines providing position information for the annotation. |
Methods
isWeightVisible()
Trueif the edge weight is visible either becauseweightVisibleisTrueor the document’sedgeWeightsVisiblesetting isTrue, otherwiseFalse.
isAnnotationVisible()
Trueif the edge annotation is visible either becauseannotationVisibleisTrueor the document’sedgeAnnotationsVisiblesetting isTrue, otherwiseFalse.
equals( object )
Returns
Trueif object represents the same edge asself.
EntityClass
The EntityClass class represents an entity class.
Fields
| Field | Type | Description |
|---|---|---|
name | string | The class name. |
builtIn | boolean | Read only. True if the domain is built-in and therefore cannot be modified. |
color | Color | The background color behind the class title. |
weight | number | The default weight for new edges created along with entities of this class, as a value between -1.0 and 1.0. |
symbol | Symbol | The symbol inherited by new entities of this class. |
milestone | boolean | True if entities derived from this class should be a milestone (zero effort) task, otherwise False. |
resourceAssignment | Resource Assignment Type | The default resource assignment for entities derived from this class should be a milestone (zero effort) task, otherwise False. |
showName | boolean | True if the class name should be shown, defaults to True. |
domain | Domain | Read only. The parent domain of this class. |
nameColor | Color | Read only. The color that the name of the entity class would be rendered in an entity. |
Methods
duplicate( )
Creates and returns a unique duplicate of this class with the name modified to include “copy,” as an EntityClass.
Entity
Entity is derived class of VertexElem and represents an entity.
Fields
| Field | Type | Description |
|---|---|---|
isEntity | boolean | Read only. Returns True. |
title | string | The title of the Entity. |
confidence | number | The confidence, as a value between 0.0 and 1.0. |
canDrive | boolean | Read Only. True if this entity can drive confidence; i.e., it has no predecessors ignoring back edges. |
completion | number | Read Only. The completion, as a value between 0.0 and 1.0. Zero if project management not enabled. |
effortHours | number | The effort in hours, as a positive floating-point value or zero for a milestone. Zero if project management not enabled. |
startDate | Date or None | The start date, as a Date. None if project management not enabled. |
finishDate | Date or None | The finish date, as a Date. None if project management not enabled. |
endDate | Date or None | The finish date, as a Date. None if project management not enabled.!Deprecated: use finishDate instead. |
startTime | Time or None | Read only. The start time, as a Time. None if project management not enabled. |
finishTime | Time or None | Read only. The finish time, as a Time. None if project management not enabled. |
resources | list of Resource | Read only. A list of resources assigned to a task. The list can be empty. |
resourceAssignment | Resource Assignment Type | The current setting for how resources are assigned to a task. |
symbol | Symbol or None | The directly set symbol for this entity, as a Symbol, otherwise None. |
inheritedSymbol | Symbol or None | Read only. The symbol for this entity, either the directly set Symbol or the one inherited from its EntityClass. None if both values are None. |
entityClass | EntityClass | The class of the Entity. |
entityID | integer | Read only. The element’s entity ID. Can be zero if entityID are not currently visible. |
chartRowEffortString | string | Read only. The string that would be displayed for the entity’s effort in chart view or None is project management not enabled. |
preferredStartDate | Date or None | The preferred start date, as a Date. None if the entity has no preferred start date or project management not enabled. |
preferredFinishDate | Date or None | The preferred finish date, as a Date. None if the entity has no preferred finish date or project management not enabled. |
preferredDateError | boolean | Read only. Set to True if the entity exhibits a date error, otherwise False. |
resourceString | string or None | Read only. The string that would be displayed for the entity’s resources in graph view, or None if no resources assigned or project management not enabled. |
chartRowResourceString | string or None | Read only. The string that would be displayed for the entity’s resources in chart view, or None if no resources assigned or project management not enabled. |
startDateString | Date or None | Read only. The string that would be displayed for the entity’s start date, or None if project management not enabled. |
finishDateString | Date or None | Read only. The string that would be displayed for the entity’s finish date, or None if project management not enabled. |
titleFont | FontSpec | Read only. The FontSpec used to render the entity title. |
titleLines | list of LayoutLine | Read only. A list of LayoutLines providing position information for the entity title. |
Methods
equals( object )
Returns
Trueifobjectrepresents the same entity as self.
addResource( resource )
Assigns the given
resourceto the task.
removeResource( resource )
Removes the given
resourceassigned to the task.
FontSpec
The FontSpec class represents a specification for a font. The constructor is accessible from scripts.
Fields
| Field | Type | Description |
|---|---|---|
family | string | Read only. The font family; e.g., Arial, New Times Roman, SansSerif, etc. |
style | Font Style Type | Read Only. The derived style of the font, plain, bold, italic or bold/italic. Note that fonts like Arial Bold that have an inherent style have this field set to plain. |
size | number or AUTOSIZE | Read Only. The point size of the font. Can be set to AUTOSIZE when the entityTitleFont field of the Document is involved. |
ascent | number | Read only. The ascent of the font. If you construct a FontSpec at runtime, you must call the calcFont method in a Document instance to make this field valid. |
descent | number | Read only. The descent of the font. If you construct a FontSpec at runtime, you must call the calcFont method in a Document instance to make this field valid. |
uppercaseHeight | number | Read only. The maximum ascent of the letters X, O, and M of the font. If you construct a FontSpec at runtime, you must call the calcFont method in a Document instance to make this field valid. |
Methods
init( family, style, size )
Creates a new FontSpec with the given family, style and size.
Constants
Font Style Type
PLAIN
Indicates a style of plain.
BOLD
Indicates a style of bold. This can be or’ed with
ITALIC.
ITALIC
Indicates a style of italic. This can be or’ed with
BOLD
Font Size Type
AUTOSIZE
Indicates the size should be determined algorithmically. Only used for the
entityTitleFontfield of Document.
GraphElemFilter
GraphElemFilter is a base class for any class used to filter graph elements (instances of GraphElem). The Application class provides six pre-defined instances to filter for entities, junctors, groups, edges, start entities and end entities. Script writers can also create classes derived from GraphElemFilter to perform arbitrary filtering.
Methods
filter( elem )
Returns
Trueif the elem matches the filter. Derived classes should override this method. Reminder: Your derived class needs to includeselfas the first parameter, withelemas the second.
GraphElem
The GraphElem is the base class for all representations of graph elements: entities, junctors, groups and edges. This class has variables and methods common to all elements.
Fields
| Field | Type | Description |
|---|---|---|
eid | integer | Read only. Unique integer assigned to each GraphElem. |
isEntity | boolean | Read only. Returns False (see Entity.) |
isJunctor | boolean | Read only. Returns False (see Junctor.) |
isGroup | boolean | Read only. Returns False (see Group.) |
isEdge | boolean | Read only. Returns False (see Edge.) |
canHaveParent | boolean | Read only. Returns False (see VertexElem.) |
hasParent | boolean | Read only. Returns True if has parent. |
frame | tuple | Read only. The element’s bounds as a tuple (left, top, width, height), or (0, 0, 0, 0) if the element is hidden in a collapsed group. |
annotation | string or None | The annotation (note) of the element, an HTML document as a string, or None if the element has no note. If set to plain text, the font of the annotation defaults to Monospaced/12. |
isHiddenInCollapse | boolean | Returns True if the element is in a collapsed group, otherwise False. |
hasAnnotation | boolean | Returns True if the element has an annotation, otherwise False. |
annotationNumber | integer | Read only. The annotation (note) number of the element, an integer, or zero if the element has no note. |
displayAnnotationNumber | integer | Read only. The annotation (note) number of the element if note numbers are displayed as an integer, or zero if the element has no note or note numbers are not displayed. |
partFrames | dictionary | Read only. A dictionary of tuples (x, y, width, height). The keys are Shape Part Types for visual elements that vary by GraphElem type and state. |
plainAnnotation | string or None | Read only. the annotation (note) of the element as plain text, or None if the element has no note. |
annotationEditor | TextEditor | Returns a TextEditor instance which allows for modification of the annotation, or None if the element has no note (variable is read only, the TextEditor itself can be modified). |
user | dictionary | A dictionary containing user defined attributes (variable is read only, the dictionary itself can be modified) Example: previousFacility = elem.user['facility']; elem.user['facility'] = 'Los Angeles'; del elem.user['careless'] |
GraphOperator
Any object passed to the operate method of Document must be an instance of a class derived from the GraphOperator class.
Methods
operate( elem )
Called for each graph element the
flagsparameter of the Document’soperatemethod. Derived classes should override this method. Reminder: Your derived class needs to includeselfas the first parameter, withelemas the second.
Group
Group is derived class of VertexElem and represents a group.
Fields
| Field | Type | Description |
|---|---|---|
isGroup | boolean | Read only. Returns True. |
title | string | The title. |
color | Color | The background color. |
symbol | Symbol or None | The symbol for this group. |
collapsed | boolean | True if the group is collapsed. |
children | list of VertexElem | Read only. The elements contained in the group. |
startDate | Date or None | Read only. The start date, as a Date. Same as the start time of the earliest scheduled child. None if project management not enabled or group has no children. |
finishDate | Date or None | Read only. The finish date, as a Date. Same as the finish time of the latest scheduled child. None if project management not enabled or group has no children. |
startTime | Time or None | Read only. The start time, as a Time. Same as the start time of the earliest scheduled child. None if project management not enabled or group has no children. |
finishTime | Time or None | Read only. The finish time, as a Time. Same as the finish time of the latest scheduled child. None if project management not enabled or group has no children. |
startDateString | string or None | Read only. The string that would be displayed for the group’s start date, or None if project management not enabled. |
finishDateString | string or None | Read only. The string that would be displayed for the group’s finish date, or None if project management not enabled. |
titleFont | FontSpec | Read only. The FontSpec used to render the group title. |
titleLines | list of LayoutLine | Read only. A list of LayoutLines providing position information for the group title. |
Methods
deepCollapse( )
Performs a deep collapse on the group.
deepExpand( )
Performs a deep expand on the group.
Junctor
Junctor is derived class of VertexElem and represents a junctor.
Fields
| Field | Type | Description |
|---|---|---|
isJunctor | boolean | Read only. Returns True. |
operator | VertexOperator | The operator. |
LayoutLine
Contains position information about one line of text in a title or annotation. This can be used to extract the actual text from a string or rendering attributes from a TextEditor instance.
Fields
| Field | Type | Description |
|---|---|---|
start | integer | Read only. The index of the first character in this line. |
count | integer | Read only. The number of characters in this line. |
position | tuple | Read only. The baseline position of the first character in the line as a tuple (x, y). |
bounds | tuple | Read only. The frame of the characters in this line as a tuple (x, y, width, height). |
Resource
The Resource class represents the information about a human, capital or production resource that can be assigned to a task. The constructors are not accessible from scripts.
Fields
| Field | Type | Description |
|---|---|---|
resourceId | integer | Read only. An internal integer value assigned to each resource, unique in each document. |
name | string | The full name of the resource. |
units | number | A floating point value indication the amount of time the resource is used on the resource. For example a value of 0.5 for a resource with an 8 hour work day only works 4 hours per day on the project. Can be greater than 1.0 to represent multiple equivalent resources; e.g., “technical writing staff.” Defaults to 1.0. |
abbreviation | string | An abbreviation for the resource used to reduce display size. |
utilization | number | Same as units. Deprecated — may be removed in a future release. |
calendar | Workweek | The calendar being used by this resource. Defaults to the standard calendar. |
Symbol
The Symbol class represents a symbol. Symbol instances are immutable.
Fields
| Field | Type | Description |
|---|---|---|
symbolID | string | Read only. The unique ID for this symbol. |
identifier | string | Read only. A string suitable as a parameter to the Document method getSymbolByName. |
Methods
equals( object )
Returns True if object represents the same symbol as self.
generateSvg(document, x, y, scale, maxSize)
Generate an SVG fragment that renders the symbol at the given position with given scale factor (see Symbol Scale and Size Type) and
maxSize, a tuple of (width, height) and can beNone.
TextEditor
Annotations can be edited via a TextEditor instance instead of having to modify the annotation as a string value, which can be difficult as an annotation is in HTML format. A TextEditor for an annotation is provided via the GraphElem method annotationEditor.
Fields
| Field | Type | Description |
|---|---|---|
length | integer | Read only. Length of the “plain” text. |
text | string | Read only. The styled text as an HTML document. |
plainText | string | Read only. The plain text; i.e., the same as text above but with all HTML tags removed. |
selection | string | Read only. The currently selected text as plain text. |
selectionStart | integer | The start of the selection. |
selectionEnd | integer | The end of the selection, always greater than selectionStart. |
selectionAttributes | dictionary | Read only. The attributes of the text at selectionStart, as a dictionary of Text Editor Type. |
Methods
flush( )
Saves all changes to the text, possibly creating an undo record.
replace( string, attributes )
Replaces the text between selectionStart and selectionEnd with string, assigning the given attributes dictionary to the new text, and sets selectionEnd to selectionStart plus the length of string (see the Text Editor Type in Application class for possible attributes keys and values).
insert( string, attributes )
Inserts string at selectionStart, assigning the given attributes dictionary to the new text, and sets selectionEnd to selectionStart plus the length of string (see the Text Editor Type in Application class for possible attributes keys and values).
remove( )
Deletes the text between selectionStart and selectionEnd and sets selectionEnd to selectionStart.
runStart( )
Searching backwards, finds the first character not matching the attributes at selectionStart starting at selectionStart and returns the index of the next character (as an integer) or zero if the start of the text is reached.
runStart( attributes )
Searching backwards, finds the first character not matching the given attributes starting at selectionStart and returns the index of the next character (as an integer) or zero if the start of the text is reached.
runLimit( )
Searching forward, finds the first character not matching the attributes at selectionStart starting at selectionStart, and returns the index of that character minus the result of calling runStart( ), as an integer.
runStart( attributes )
Searching backwards, finds the first character not matching the given attributes starting at selectionStart, and returns the index of that character minus the result of calling runStart( attributes), as an integer.
runOfSame()
Returns the number of characters with the same attributes beginning at start of string.
runOfSame(start)
Returns the number of characters with the same attributes beginning at start.
reset( string )
Replaces all the text in the editor with string, which must be an HTML document.
Time
The Time class represents a time during a day. Time instances are immutable. The constructors are accessible from scripts.
Fields
| Field | Type | Description |
|---|---|---|
hours | integer | Read only. The hour, from 0 to 23. |
minutes | integer | Read only. The minute, from 0 to 59. |
seconds | integer | The second, from 0 to 59. |
Methods
init( )
Constructs a new Time instance for the current time.
init(time)
Constructs a new Time instance from the given time.
VertexElem
VertexElem is derived class of GraphElem and is a base class representing an entity, junctor and group.
Fields
| Field | Type | Description |
|---|---|---|
canHaveParent | boolean | Read only. Returns True. |
parent | Group or None | The parent Group of the element or None if the element is at the top of the hierarchy |
hasInEdges | boolean | Read only. True if the element has any predecessors, implying it has at least one in-edge. Ignores back edges during a call to the operate method of Document. |
hasOutEdges | boolean | Read only. True if the element has any successors, implying it has at least one out-edge. Ignores back edges during a call to the operate method of Document. |
inEdges | list of Edge | Read only. A list of the element’s in-edges. Does not include back edges during a call to the operate method of Document |
outEdges | list of Edge | Read only. A list of the element’s out-edges. Does not include back edges during a call to the operate method of Document |
index | integer | Read only. The index of the element in chart view or zero if canvas not in chart view |
VertexOperator
A VertexOperator is the base class for system operators like Fuzzy And, Fuzzy Or, etc. Instances of VertexOperator are immutable.
Fields
| Field | Type | Description |
|---|---|---|
name | string | Read Only. User interface long name of the operator; e.g., “Fuzzy And”. |
abbreviation | string | Read only. User interface short name of the operator; e.g., “AND”. |
asciiAbbreviation | string | Read only. User interface ASCII-compliant short name of the operator; e.g., “AND” (read only) |
color | Color | Read only. The fill color. |
Workweek
The Workweek class represents the information about what the work schedule for project management calculations. The constructors are not accessible from scripts.
Fields
| Field | Type | Description |
|---|---|---|
calendarId | integer | Read only. An internal value assigned to each calendar, unique in each document. The standard calendar is always has a value of 1. |
workdays | integer | The days of the week that are work days, as a bit field (see Workday Type below). |
events | list of CalendarEvent | Read only. The exceptions to the work schedule. |
Methods
init( workdays )
Creates a new Workweek with the given
workdayswith no work schedule exceptions.
init( workweek )
Creates a new Workweek which is a deep copy of given Workweek instance.
checkWorkDay( day )
Returns
Trueif the givendayis a regular work day for this Workweek, where day is one of the Workday values below.
checkWorkDay( date )
Returns True if the given
date(a Date instance) would be a work day for this Workweek with exceptions considered.
addExceptionForDate( date )
Adds an exception to the work schedule for given
date.
removeExceptionForDate( date )
Removes an exception to the work schedule for given
date.
Constants
Workday Type
MONDAY_MASK
TUESDAY_MASK
WEDNESDAY_MASK
THURSDAY_MASK
FRIDAY_MASK
SATURDAY_MASK
SUNDAY_MASK
DEFAULT_WORKDAYS
Bit values for days of the week. DEFAULT_WORKDAYS is the same as the masks for Monday through Friday, OR'd together.
Constants
Collections of constants used throughout the Flying Logic scripting API.
All the constants in this section are defined in the Application class.
Orientation Type
ORIENTATION_LEFT_TO_RIGHT
ORIENTATION_RIGHT_TO_LEFT
ORIENTATION_TOP_TO_BOTTOM
ORIENTATION_BOTTOM_TO_TOP
ORIENTATION_INNER_TO_OUTER
ORIENTATION_OUTER_TO_INNER
Example:
Application.defaultOrientation = Application.ORIENTATION_LEFT_TO_RIGHT
Bias Type
BIAS_START
BIAS_END
Example:
Application.defaultBias = Application.BIAS_START
Compactness Type
COMPACTNESS_RELAXED
COMPACTNESS_COMFORTABLE
COMPACTNESS_COMPACT
Example:
Application.graphCompactness = Application.COMPACTNESS_COMFORTABLE
Animation Style Type
ANIMATION_FIXED_FRAME_RATE
ANIMATION_FIXED_TIME
Example:
Application.animationStyle = Application.ANIMATION_FIXED_FRAME_RATE
Edge Colors Type
EDGE_RED_GRAY_BLACK
EDGE_RED_YELLOW_BLACK
EDGE_RED_YELLOW_GREEN
Example:
Application.edgeColors = Application.EDGE_RED_GRAY_BLACK
Spinner Display Type
SPINNER_DISPLAY_NONE
SPINNER_DISPLAY_NUMERIC
SPINNER_DISPLAY_SYMBOL
Example:
Application.spinnerDisplay = Application.SPINNER_DISPLAY_SYMBOL
Export Type
EXPORT_DIAGRAM_PDF
EXPORT_DIAGRAM_JPEG
EXPORT_DIAGRAM_PNG
EXPORT_DIAGRAM_DOT
EXPORT_ANNOTATIONS_PDF
EXPORT_ANNOTATIONS_TEXT
EXPORT_OUTLINE_OPML
EXPORT_DIAGRAM_PROJECT_XML
EXPORT_DIAGRAM_PROJECT_MPX
EXPORT_DIAGRAM_CONCERTO*
EXPORT_DIAGRAM_XSLT
*New for
Example:
document.exportDocument( Application.EXPORT_DIAGRAM_PDF, None, () )
Import Type
IMPORT_DIAGRAM_CSV
IMPORT_DIAGRAM_XSLT
IMPORT_DIAGRAM_PROJECT
Example:
document.importDocument( IMPORT_DIAGRAM_CSV,None, () )
Image Export Type
IMAGE_EXPORT_WIDTH
IMAGE_EXPORT_HEIGHT
IMAGE_EXPORT_RESOLUTION
IMAGE_EXPORT_SHOW_SELECTION
IMAGE_EXPORT_SAVE_INK
IMAGE_EXPORT_EMBED_FONTS
These types are used as keys in a dictionary, the value being the setting for the key. If a type appears in the dictionary, it overrides the current setting.
Example:
params = ( Application.IMAGE_EXPORT_SHOW_SELECTION : False )
document.exportDocument(Application.EXPORT_DIAGRAM_JPEG, params)
Weekday Type
SUNDAY_MASK
MONDAY_MASK
TUESDAY_MASK
WEDNESDAY_MASK
THURSDAY_MASK
FRIDAY_MASK
SATURDAY_MASK
DEFAULT_WORKDAYS
These are the same constants found in the Workweek class and duplicated here for convenience. See Workweek class for details.
OPML Export Type
OPML_EXPORT_FORWARD
OPML_EXPORT_UNICODE
OPML_EXPORT_INCLUDE_EQUATION
These types are used as keys in a dictionary, the value being the setting for the key. If a type appears in the dictionary, it overrides the current setting.
Example:
params = ( Application.EXPORT_OUTLINE_OPML: False )
document.exportDocument(Application.EXPORT_DIAGRAM_JPEG, params)
MS Project Export Type
MSPROJECT_EXPORT_ROUNDTRIP_LOW_CUSTOM_FIELDS						MSPROJECT_EXPORT_ROUNDTRIP_HIGH_CUSTOM_FIELDS
MSPROJECT_EXPORT_ROUNDTRIP_HIGH_CUSTOM_FIELDS
CSV Import Type
CSV_ENCODING
CSV_SEPARATOR
CSV_HEADER_ROW
CSV_TITLE_COLUMN
CSV_CLASS_COLUMN
CSV_ANNOTATION_COLUMN
CSV_CONNECTIONS_COLUMN
CSV_CONNECTIONS_TYPE
CSV_CHILDREN_COLUMN
CSV_INTERNAL_SEPARATOR
CSV_ROW_INDEX
CSV Import Encoding Value
CSV_ENCODING_ISO_8859_1
CSV_ENCODING_UTF8
CSV_ENCODING_ASCII
CSV Import Separator Value
CSV_SEPARATOR_COMMAS
CSV_SEPARATOR_TABS
CSV_SEPARATOR_SEMICOLONS
CSV Import Connection Value
CSV_PREDESSORS
CSV_SUCCESSORS
CSV Import Row Index Values
May also be an integer.
CSV_ROWS_ONE_BASIS
CSV_ROWS_ZERO_BASIS
XSLT Import-Export Type
XSLT_ASK
XSLT_FILE
XSLT_STRING
DOM_MODIFY_FUNCTION
XSLT_INCLUDE_FRAMES
XSLT_INCLUDE_EDGE_SPLINES
These types are used as keys in a dictionary, the value being the setting for the key.
The first three values are mutually exclusive and indicate the source of the XSLT file: either ask the user for locate the file (value should be True), use the given file (the value is the path to the file as a string), or use the already loaded/embedded string (XLST file as a string).
The last two are only used when exporting, and indicate whether the Flying Logic document to be transformed should include graph element frames and edge splines.
Example:
params = (
  Application.XSLT_ASK : True,
  Application.XSLT_INCLUDE_FRAMES : True
)
document.exportDocument(Application.EXPORT_DIAGRAM_XSLT, params)
Find Type
FIND_CASE_SENSITIVE
FIND_WHOLE_WORDS_ONLY
FIND_SEARCH_TITLES # API 1.14
FIND_SEARCH_LABELS # Deprecated, same as FIND_SEARCH_TITLES
FIND_SEARCH_ANNOTATIONS
FIND_SEARCH_UDA_NAMES
FIND_SEARCH_UDA_VALUES
FIND_SEARCH_RESOURCES
FIND_SELECT_COLLAPSED_GROUPS
These types are used as keys in a dictionary, the value being the setting for the key. If a type appears in the dictionary, it overrides the current setting.
Example:
params = ( Application.FIND_SEARCH_ANNOTATIONS:True )
document.find(‘communicate’, params)
Operate Type
OPERATE_ENTITY
OPERATE_JUNCTOR
OPERATE_EDGE
OPERATE_REVERSE
OPERATE_NON_EDGE
OPERATE_ALL
The first four types above are bit fields. The first three limit which graph element types are operated upon, while OPERATE_REVERSE indicated the elements should be iterated through end to start. OPERATE_NON_EDGE is the same as OPERATE_ENTITY | OPERATE_JUNCTOR, and OPERATE_ALL should be obvious.
Example:
mask = Application.OPERATE_ENTITY | Application.OPERATE_REVERSE
document.operate(myGraphOperator, mask)
Symbol Name Type
BITMAP_PREFIX
SVG_PREFIX
SYMBOL_SEPARATOR
BITMAP_PREFIX and SVG_PREFIX are the generator names for bitmap images and SVG drawing custom symbols. SYMBOL_SEPARATOR is the a colon.
See Graphic Symbol Names for a list of the built-in symbol name constants.
Special Symbol Type
INHERIT_SYMBOL
NO_SYMBOL
Special predefined Symbol instances. INHERIT_SYMBOL will set an entity’s symbol back to the default for its entity class. NO_SYMBOL will set an entity’s symbol to none, overriding any possible default symbol for its entity class. For groups both INHERIT_SYMBOL and NO_SYMBOL clear the group symbol.
Text Editor Type
BOLD
ITALIC
UNDERLINED
STRIKETHROUGH
LINK
FONT_SIZE
FONT_FAMILY
FONT_COLOR
These types are used as keys in a dictionary, the value being the attribute for the key.
Example:
editor.changeSelectionAttributes( ( Application.BOLD: True ) )
Edge Part Type
EDGE_HEAD
EDGE_TAIL
Which end of an edge to reconnect.
Example:
document.reconnect( edge, Application.EDGE_TAIL, entity )
Shape Part Type
PART_WEIGHT
PART_ANNOTATION
PART_HOIST_CAP
PART_CONFIDENCE
PART_COMPLETION
PART_ENTITYID
PART_TITLE
PART_CLASS
PART_CLASS_BKGD
PART_START_DATE
PART_FINISH_DATE
PART_RESOURCES
PART_DISCLOSURE
PART_SYMBOL
PART_ANNOTATION_NUMBER
PART_ANNOTATION_TEXT
PART_COMPLETION_BAR
PART_EDGE_INFO
Parts of an element's shape.
Chart Part Type
PART_CHART_ROW
PART_CHART_INDEX
PART_CHART_ANNOTATION
PART_CHART_DISCLOSURE
PART_CHART_SYMBOL
PART_CHART_TITLE
PART_CHART_CLASS
PART_CHART_CLASS_COLOR
PART_CHART_CONFIDENCE
PART_CHART_ENTITYID
PART_CHART_START_DATE
PART_CHART_FINISH_DATE
PART_CHART_COMPLETION
PART_CHART_RESOURCES
PART_CHART_EFFORT
Parts of the chart table.
Other Font Type
AUTOSIZE
A special “font size” that means “set the size as the application sees fit.”
Example:
document.titleFontSize = Application.AUTOSIZE
File Type
FILE_SEPARATOR
DOCUMENT_EXTENSION
TEMPLATE_EXTENSION
DOMAIN_EXTENSION
These are various file-lated constants: the system-dependent file path separator, the Flying Logic document file extension, the Flying Logic template file extension, and the Flying Logic domain file extension.
Schedule Type
SCHEDULE_FROM_START_DATE
SCHEDULE_FROM_FINISH_DATE
Direction that project should be scheduled.
Open Document Option Type
OPEN_DOCUMENT_IN_WINDOW
OPEN_DOCUMENT_IN_TAB
OPEN_DOCUMENT_ASK
Valid values for the openDocumentOption preference.
Canvas View Type
GRAPH_VIEW
CHART_VIEW
Canvas view kinds.
Resource Assignment Type
RESOURCE_FIXED_EFFORT
RESOURCE_FIXED_DURATION
RESOURCE_FIXED_UNITS
RESOURCE_FIXED_WORK
If two or more resources are assigned to a task, this value determines how those resources are applied. With RESOURCE_FIXED_EFFORT the effort is considered total work hours to be distributed between resources. With RESOURCE_FIXED_DURATION, the effort acts as a fixed duration and resources all work that number of hours on the task. Finally, RESOURCE_FIXED_UNITS results in each resource only working part-time on the task.
Edge Spline Type
PART_HEAD
PART_MIDDLE
PART_TAIL
Types that appear in a spline dictionary.
Diagram Import Type
DIAGRAM_IMPORT_NEW_DOCUMENT
DIAGRAM_IMPORT_PM_DOMAIN
DIAGRAM_INCLUDE_TOP_GROUP
These types are used as keys in a dictionary, the value being the setting for the key. If a type appears in the dictionary, it overrides the current setting. All the current settings are booleans.
Static Font Type
FONT_SPINNER_LARGE
FONT_SPINNER_SMALL
FONT_SPINNER_UNDEFINED
FONT_ANNOTATION_ICON
FONT_ANNOTATION_NUMBER
FONT_DATE
FONT_DATE_BOLD
FONT_ROW
FONT_ROW_BOLD
FONT_CAP_ENTITY_ID
FONT_JUNCTOR_LARGE
FONT_JUNCTOR_SMALL
FONT_JUNCTOR_CHART
FONT_CHART_CALENDAR
Symbolic names of various fonts used to display shapes. Used in Document’s findStaticFont method.
Symbol Scale and Size Type
GRAPH_SYMBOL_SCALE
CHART_SYMBOL_SCALE
Scale factors when calling the generateSvg method of Symbol class.
CHART_SYMBOL_SIZE
Can be used as maxSize when calling the generateSvg method of the Symbol class for chart-like output. Graph-like output should set maxSize to None indicating an unconstrained size.
Graphic Symbol Names
The names that represent the iconic symbols used in Flying Logic.
The getSymbolByName method in the Document class can be used to create an instance of the Symbol class that can be assigned to the symbol field of an entity, group or custom entity class. The format of these names is generator:id; i.e., a generator name and a symbol ID separated by a colon.
For custom symbols generator is either com.arciem.symbol.SVGSymbolGenerator for SVG drawings and com.arciem.symbol.BitmapSymbolGenerator for bitmap images; e.g., PNG, JPEG, GIF, etc. The id will be a UUID as a string.
The Application object has predefined constants for all the symbols built-in to Flying Logic. One of these constants can be supplied as a parameter to the getSymbolByName method of a Document instance.
| Symbol Name Constant | Image |
|---|---|
DINGBAT_ARROW_RIGHT | |
DINGBAT_ASTERISK |  |
DINGBAT_BALLOT_X |  |
DINGBAT_CHECK_MARK |  |
DINGBAT_HAND_RIGHT |  |
DINGBAT_HEART |  |
DINGBAT_INTL_NO |  |
DINGBAT_LIGHTNING |  |
DINGBAT_QUESTION_MARK |  |
DINGBAT_STAR |  |
FLOWCHART_CARD |  |
FLOWCHART_CIRCLE_DOUBLE |  |
FLOWCHART_CIRCLE |  |
FLOWCHART_CONNECTOR_OFF_PAGE |  |
FLOWCHART_CONNECTOR_ON_PAGE |  |
FLOWCHART_CRYSTAL |  |
FLOWCHART_CYLINDER |  |
FLOWCHART_DISPLAY |  |
FLOWCHART_DOCUMENT |  |
FLOWCHART_HEXAGON |  |
FLOWCHART_LOZENGE |  |
FLOWCHART_OCTAGON |  |
FLOWCHART_OVAL |  |
FLOWCHART_PARALLELOGRAM |  |
FLOWCHART_PENTAGON |  |
FLOWCHART_RECTANGLE_BOW_LEFT |  |
FLOWCHART_RECTANGLE_BOW_OUT |  |
FLOWCHART_RECTANGLE_LINED |  |
FLOWCHART_RECTANGLE_ROUND |  |
FLOWCHART_RECTANGLE |  |
FLOWCHART_SLANT |  |
FLOWCHART_SQUARE_CIRCLE |  |
FLOWCHART_SQUARE_LINED |  |
FLOWCHART_SQUARE |  |
FLOWCHART_STRIP |  |
FLOWCHART_TAPE |  |
FLOWCHART_TRAPEZOID_DOWN |  |
FLOWCHART_TRIANGLE_DOWN |  |
FLOWCHART_TRIANGLE_UP |  |
WRITING_BALLOON_DIALOG |  |
WRITING_BALLOON_SHOUT |  |
WRITING_BALLOON_TALK |  |
WRITING_BALLOON_THINK |  |
Importer and Exporter Examples
JSON Importer Example
In this section a simple JSON document importer is implemented. The format of the JSON supported by this importer is just an example and not based on any existing format.
When the script is run through the File -> Import -> Import via Script -> Open Script… command, it will ask for a file to import and then a dialog allowing for two options: Create new document and whether Connections are predecessors or successors:
.png)
Example JSON File
{
  "groups": [
    {
      "children": [
        4,
        2,
        3
      ],
      "index": 1,
      "title": "G"
    }
  ],
  "nodes": [
    {
      "connections": [],
      "index": 2,
      "title": "E",
      "type": "Action"
    },
    {
      "connections": [],
      "index": 3,
      "title": "D",
      "type": "Action"
    },
    {
      "connections": [
        2,
        3
      ],
      "index": 4,
      "title": "C",
      "type": "Intermediate Effect"
    },
    {
      "connections": [],
      "index": 5,
      "title": "B",
      "type": "Action"
    },
    {
      "connections": [
        4,
        5
      ],
      "index": 6,
      "title": "A",
      "type": "Goal"
    }
  ]
}
The format of this JSON file allows for a list of “nodes” that are interpreted as entities and “groups” which are interpreted as, well, groups. Only fields for titles, entity classes, edges (as “connections”) and children elements of groups are parsed. It is left to an excessive to the reader to add annotations, junctors, project management data, etc.
The example file generates the following diagram:
.png)
JSON Importer Code
# import_json_example.py
# import the contents of a simple JSON file into Flying Logic
# option for having connections be to predecessors or successors
# creates entities, groups and edges, but not junctors
# Copyright 2025 Flying Logic

import json
from javax.swing import Box, BoxLayout, JLabel, JCheckBox, JComboBox

importItemLabel = "Import from JSON Example"

# importDocument: required function for an importer
# parameters
#      file: filename of the file to import
def importDocument(file):
	# make a UI using Java
	masterBox = Box(BoxLayout.Y_AXIS)

	# new document?
	controlBox = Box(BoxLayout.X_AXIS)
	newDocCheckbox = JCheckBox("Create new document")
	controlBox.add(newDocCheckbox)
	controlBox.add(Box.createHorizontalGlue())
	masterBox.add(controlBox)

	# connections meaning
	controlBox = Box(BoxLayout.X_AXIS)
	controlBox.add(JLabel("Connections are: "))
	connectionsComboBox = JComboBox(["Predecessors", "Successors"])
	controlBox.add(connectionsComboBox)
	masterBox.add(controlBox)

	# display dialog and collect options
	if 0 == Application.request("JSON Import Settings", masterBox, ("Cancel", "OK")):
		return

	# get options from user choices
	createNewDocument = newDocCheckbox.isSelected()
	connectionsAsSuccessors = (connectionsComboBox.selectedIndex == 1)

	# create a new doc if desired
	if createNewDocument:
		theDoc = Application.newDocument()
	else:
		theDoc = document

	# open and parse JSON file
	with open(file, "r") as infile:
		json_object = infile.read()
		data = json.loads(json_object)

		entityDict = { }
		groupDict = { }

		# process "nodes" as entities
		# we will create all entties and then deal with connections
		if 'nodes' in data:
			for node in data['nodes']:
				# with None parameter, no need to clear selection
				entity = theDoc.addEntityToTarget(None)[0]
				entity.title = node['title']
				entity.entityClass = theDoc.getEntityClassByName(node['type'])
				entityDict[node['index']] = (entity, node['connections'])

		# process "groups" as groups
		# we will create all groups and then deal with children
		if 'groups' in data:
			for node in data['groups']:
				# with None parameter, no need to clear selection
				group = theDoc.newGroup(None)[0]
				group.title = node['title']
				groupDict[node['index']] = (group, node['children'])

		# process connections
		for data in entityDict.values():
			entity = data[0]
			for connection in data[1]:
				other = entityDict[connection][0]
				if connectionsAsSuccessors:
					theDoc.connect(entity, other)
				else:
					theDoc.connect(other, entity)

		# process children, which can be an entity or group
		for data in groupDict.values():
			group = data[0]
			for index in data[1]:
				if index in entityDict:
					child = entityDict[index][0]
				else:
					child = groupDict[index][0]
				child.parent = group
Click here to view the script import_json_example.py in a new tab and use your browser's Save As... option to download.
Example DOT Exporter
The code below exports a document to a DOT (GraphViz) file, but with less features than the native export option in Flying Logic.
When the script is run through the File -> Export -> Export via Script -> Open Script… command, it will export the diagram into the file specified.
# export_dot.py
# a simple DOT format exporter, less complete then the native version in Flying Logic
# Copyright 2013 Arciem LLC

# required variable that provided the label for the item in Flying Logic export menu
exportMenuLabel = "Export Diagram to simple DOT format"

# exportDocument: required function for an exporter
# parameters
# file: filename of the file to export
def exportDocument(file):
  # open output file using Python file I/O
  fh = open(file, 'w')

  fh.write("digraph graphname {\n")
  for elem in document.all:
    if elem.isGroup or elem.isEdge:
      continue

    # use the element unique id’s (eid) to create unique id’s in DOT
    if elem.isEntity:
      fh.write("\tn" + str(elem.eid) + " [label=\"" + elem.title + "\"];\n")
    if elem.isJunctor:
      fh.write("\tn" + str(elem.eid) + " [label=\"" + elem.operator.abbreviation + "];\n")
    for outEdge in elem.outEdges:
      fh.write("\tn" + str(elem.eid) + " -> n" + str(outEdge.target.eid) + ";\n")
      fh.write("\t}\n")

  fh.close()
Click here to view the script export_dot.py in a new tab and use your browser's Save As... option to download.
Example Task Duration to CSV Exporter
The code below exports a document with project management information to a CSV (Comma-Separated Values) file. In addition to task names and durations being exported, completion percentage and outline level; i.e., depth in groups, are included. Entities and junctors are treated as tasks, while groups are considered summaries.
When the script is run through the File -> Export -> Export via Script -> Open Script… command, it will export the data into the file specified.
# export_task_durations.py
# Flying Logic export project management task data to CSV
# Copyright 2025 ARCIEM LLC

from datetime import datetime
# The most common Java libraries are available for import.
from java.io import FileWriter
# Conveniently, Flying Logic uses the Apache's CSV Java library, so it can be imported.
from org.apache.commons.csv import CSVFormat, CSVRecord, CSVPrinter

# label for menu item in FL
exportItemLabel = "Export Task Durations (CSV)"
# exported file should have extension .json
defaultExtensions = ["csv"]

# class that encapsulates collecting and ordering tasks
class TaskDurationsCSV:
    def __init__(self):
        # list of Concerto tasks
        self.tasks = [ ]
        # map vertices to Concerto task
        self.eid_to_task = { }
        # map vertices to an index
        self.export_indices = { }
        # create optimized order for algorithm
        self.orderedVertices = self.makeChartOrderedVertices()

    # generate top-level fields to output (only "tasks" right now)
    def generate(self):
        # generate output tasks in "nice" hierarchical order
        return self.addChildrenOfGroup(None):

    def fldateToLocalDate(self, fldate):
        return datetime.strftime(datetime.strptime(str(fldate), "%Y-%m-%d"), "%x")

    def fltimeintervalToTimeOffset(self, fltimeinterval):
        h = str(fltimeinterval.hours)
        m = str()
        s = h + "h"
        if fltimeinterval.minutes > 0:
            s += " "
            if fltimeinterval.minutes < 10:
                s += " "
            s += str(fltimeinterval.minutes) + "m"
        return s

    # Calculate the implied completion value for junctor from its predecessors.
    # The lowest such value is hoe complete it is.
    def junctorCompletion(self, junctor):
        completion = 1.0
        for edge in junctor.inEdges:
            if not edge.isBackEdge:
                source = edge.source
                if source.isJunctor:
                    c = self.junctorCompletion(source)
                elif source.isEntity:
                    c = source.completion
                else:
                    c = self.groupCompletion(source)
                if c < completion:
                    completion = c
        return completion

    # Calculate the implied completion value for group from its children.
    # The lowest such value is hoe complete it is.
    def groupCompletion(self, group):
        completion = 1.0

        for child in group.children:
            if child.isJunctor:
                c = self.junctorCompletion(child)
            elif child.isEntity:
                c = child.completion
            else:
                c = self.groupCompletion(child)
            if c < completion:
                completion = c
        return completion

    # This recursive method generates tasks in hierarchical order like
    # Flying Logic's chart mode, but makes sure children of summary tasks
    # are listed directly below the their parent and has corrent outline level.
    def addChildrenOfGroup(self, group):
        for vertex in self.orderedVertices:
            if vertex.parent == group:
                if vertex.isJunctor:
                    # calculate the next row index
                    index = len(self.export_indices) + 1
                    self.export_indices[vertex.eid] = index

                    task = {
                        "row": index,
                        "level": str(self.nestingLevel(vertex)),
                        "name": vertex.operator.abbreviation,
                        "startDate": self.fldateToLocalDate(vertex.startDate),
                        "startTime": self.fltimeintervalToTimeOffset(vertex.startTime),
                        "finishDate": self.fldateToLocalDate(vertex.finishDate),
                        "finishTime": self.fltimeintervalToTimeOffset(vertex.finishTime),
                        "complete": self.junctorCompletion(vertex)
                    }

                    # append to task list and associate with Flying Logic vertex
                    self.tasks.append(task)
                    self.eid_to_task[vertex.eid] = task
                elif vertex.isEntity:
                    # calculate the next row index
                    index = len(self.export_indices) + 1
                    self.export_indices[vertex.eid] = index

                    # make a task object with proper values
                    task = {
                        "row": index,
                        "level": str(self.nestingLevel(vertex)),
                        "name": vertex.title,
                        "startDate": self.fldateToLocalDate(vertex.startDate),
                        "startTime": self.fltimeintervalToTimeOffset(vertex.startTime),
                        "finishDate": self.fldateToLocalDate(vertex.finishDate),
                        "finishTime": self.fltimeintervalToTimeOffset(vertex.finishTime),
                        "complete": vertex.completion
                    }

                    # append to task list and associate with Flying Logic vertex
                    self.tasks.append(task)
                    self.eid_to_task[vertex.eid] = task
                elif vertex.isGroup:
                    # calculate the next row index
                    index = len(self.export_indices) + 1
                    self.export_indices[vertex.eid] = index

                    # make a task object representing a group of tasks with proper values
                    name = vertex.title
                    if len(name) == 0:
                        name = "[group]"
                    task = {
                        "row": index,
                        "level": str(self.nestingLevel(vertex)),
                        "name": name,
                        "startDate": self.fldateToLocalDate(vertex.startDate),
                        "startTime": self.fltimeintervalToTimeOffset(vertex.startTime),
                        "finishDate": self.fldateToLocalDate(vertex.finishDate),
                        "finishTime": self.fltimeintervalToTimeOffset(vertex.finishTime),
                        "complete": self.groupCompletion(vertex)
                    }

                    # append to task list and associate with Flying Logic vertex
                    self.tasks.append(task)
                    self.eid_to_task[vertex.eid] = task

                    # recurse to add children
                    if not self.addChildrenOfGroup(vertex):
                        return False
        return True

    # calculate all parents (if any) of this vertex
    def vertexAncestry(self, vertex):
        result = [ ]
        current = vertex.parent
        while current != None:
            result.append(current)
            current = current.parent
        return result

    # caluclate vertex's nesting depth
    def nestingLevel(self, vertex):
        depth = 1
        current = vertex.parent
        while current != None:
            depth += 1
            current = current.parent
        return depth

    # create a new order for vertices that allows optimal export -- similar to algorithm in Flying Logic
    def makeChartOrderedVertices(self):
        groupsProcessed = [ ]
        chartOrderedVertices = [ ]

        for vertex in document.orderedVertices:
            if not vertex.isGroup:
                if vertex.parent != None:
                    for group in reversed(self.vertexAncestry(vertex)):
                        if not group in groupsProcessed:
                            chartOrderedVertices.append(group)
                            groupsProcessed.append(group)
                chartOrderedVertices.append(vertex)
            else:
                if len(vertex.children) == 0:
                    if not vertex in groupsProcessed:
                        chartOrderedVertices.append(vertex)
                        groupsProcessed.append(vertex)

        return chartOrderedVertices

# standard Flying Logic export function
def exportDocument(filename):
    if document.startDate == None:
        # show error dialog
        Application.alert("Error! Document does not have project management information!")
        return

    # make a new instance of the TaskDurationCSV and call the generate method
    taskdata = TaskDurationsCSV()
    taskdata.generate()

    # writing to CSV file
    printer = CSVPrinter(FileWriter(filename), CSVFormat.EXCEL)
    # write header row
    printer.printRecord("Level", "Task", "Start", "Finish", "Complete")
    for task in taskdata.tasks:
        printer.printRecord(task['level'], task['name'], task['startDate'] + " " + task['startTime'],
            task['finishDate'] + " " + task['finishTime'], str(int(task['complete'] * 100)) + "%")
    printer.close(True)
Click here to view the script export_task_durations.py in a new tab and use your browser's Save As... option to download.
Flying Logic Document Format
Flying Logic documents are XML-formatted files. The schema for release 4 documents can be downloaded here. Following are some supporting tables explaining more about the schema.
Reference Tables
The table below gives information about each XML element that can be found in a Flying Logic document. The elements are listed in the order they generally appear in a document. The attributes and attribute elements are common children of many elements, so those elements and their children are documented at the end of this table. Because the words “attributes” and “attribute” are used as element names in a Flying Logic document, those words will be shown in a fixed-width font when referring to the element names and not as an XML attribute value.
| Element | Description |
|---|---|
flyingLogic | The root element. Attributes are majorversion (required, “5” for Flying Logic 4.X), minorversion, uuid, and instance. Can contain domains, symbols, displaySettings, canvasSettings, inspectorSettings, printSettings, documentInfo and decisionGraph elements. During XSLT export will also contain an exportDocumentInfo element. |
domains | The custom domains defined in the document. Can contain domain and alteredBuiltinDomain elements. |
domain | A custom domain. Contains entityclass and attributes elements. |
entityclass | Either a custom entity class in a domain or a reference to an entity class as an entity attribute. For a custom entity class, contain an attributes element. For a reference, has required XML attributes name and uuid. |
alteredBulltinDomain | Appears when a built-in domain is hidden. Required attributes are domainName and entityClass (the guid of one entity class in the domain). Contains an attributes element. |
symbols | The custom symbols defined in this document. Can contain symbol elements. |
symbol | Either a custom symbol or a reference to a symbol as an entity or group attribute. Required attributes are generator and idCode. A custom symbol definition will contain either additional elements or text depending on the format of the custom symbol, and can have a clip element. Bitmap image symbols contain a base-64 encoded dump of a PNG file as text. |
clip | A clip rectangle for a symbol. If missing, the default is the whole “image.” Required attributes are x, y, width and height. |
data | Appears in an SVG symbol. Contains a CDATA with the XML text from an SVG file. |
displaySettings | The visual elements and layout of the graph. All the attributes are optional: addEntityAsSuccessor, annotationToBrowse, bias, confidenceVisible, edgeNotesVisible, edgeWeightsVisible, entityIdVisible, noteNumbersVisible, orientation, and projectManagementVisible. |
canvasSettings | The scroll position and zoom level of the graph. Optional attributes are horizScroll, vertScroll and zoom. |
chartSettings | The column visibility and with settings for chart view. All the attributes are optional: classVisible, classWidth, completionVisible, effortVisible, finishDateVisible, resourceVisible, resourceWidth, startDateVisible, and titleWidth. |
inspectorSettings | This element has the state of the sidebar (inspector panel) and contains inspector elements. The attributes are visibility and width. |
inspector | State information about an inspector. The title attribute matches the internal name of one inspector. The optional attributes are visibility and height. Only the Domain, Text and User-Defined Attributes inspectors have a height. |
printSettings | Saved printing settings for the document. Optional attributes are footerLeft, footerMiddle, footerRight, headerLeft, headerMiddle, headerRight, paperMargins, paperName, paperOrientation, paperSize, saveInk and showselhalo. (Yes, showselhalo is all lowercase.) |
documentInfo | Has attributes for some of the values settable the Document inspector: author, comments, keywords and title. |
decisionGraph | The actual graph. Contains entityOperator, defaultJunctorOperator and logicGraph elements. |
entityOperator | The current entity operator for the graph. The class attribute is the name of a vertex operator. See notes about vertex operators at after this table. |
defaultJunctorOperator | The current default junctor operator for newly created junctors. The class attribute is the name of a vertex operator. See notes about vertex operators at after this table. |
calendars | The calendars defined in the document. Can be missing if project management has never been enabled for the document. Contains one or more indexed element elements that themselves contain a workdays element. See com.flyinglogic.app.project.Workweek in table below for details. |
resources | The resources defined in the document. Can be missing if no resources are defined. Contains one or more indexed element elements that themselves contain a resource element. See com.flyinglogic.app.project.Resource in table below for details. |
logicGraph | The organization of the graph. Contains a operatorFamily and graph element. |
operatorFamily | The key-value family of the graph. Has one required attribute class with a required value of com.flyinglogic.decisiongraph. DecisionGraphOperatorFamily. |
graph | The elements of the graph. Contains attributes, vertices and edges elements. |
vertices | Contains vertex elements representing entities, junctors and groups. |
vertex | An entity, junctor or group. Has a required attribute of eid, an unique integer assigned to each graph element. Entities and junctors have optional attributes of inEdgeOrder and outEdgeOrder, which are space-delimited list of eid values for edges connected to the element. Groups have a grouped attribute, a space-delimited list of eid values for child vertices, and an optional collapsed attribute which has a value of true is the group is collapsed. Contains an attributes element. During XSLT export can also contain an exportAttributes element. |
edges | Contains edge elements. |
edge | An edge. Has three required attributes: eid, an unique integer assigned to each graph element; and source and target, the eid of the connected vertices. During XSLT export can also contain an exportAttributes element. |
attributes | Contains attribute elements. |
attribute | An attribute is a key-value pair with an associated data type for the value. There are two required attributes, key and class. Each known class has its own format for its contents. See the table of recognized classes below. |
extendedDocumentInfo | This element only appears during XSLT export. Has attributes title (the document file name as a title), screenWidth and screenHeight (visible dimensions of graph) and hoistKey (eid of hoisted group if graph hoisted). |
exportAttributes | This element only appears during XSLT export if the flags XSLT_INCLUDE_FRAMES or XSLT_INCLUDE_EDGE_SPLINES are set in the exportDocument call. Contains exportAttribute elements. |
exportAttribute | A key-value pair with a key attribute and value of either text content or child elements. If XSLT_INCLUDE_FRAMES flag is set and a graph element is visible. it will have exportAttribute elements with values for x, y, width and height. If XSLT_INCLUDE_EDGE_SPLINES is set, a visible edge will have an exportAttribute with a key of path and contains a bezierList element. |
bezierList | Has attributes of head and tail that indicate what the edge is connected to: source, target, annotation, weight, entityhoistcap or junctorhoistcap. Contains one or more bezier elements. |
bezier | Has attributes giving the control points x1, y1, x2, y2, x3, y3, x4 and y4. |
The contents of an attribute element varies by the value of the class attribute. The first table below lists all the know keys, the class for that key and the allowed parent element of the attributes element it appears within. The second table describes the contents for each recognized class. Operators have more details after these two tables.
Value of key | Value of class | Parent elements (notes) |
|---|---|---|
user.identifier | java.lang.Stringjava.lang.Integerjava.lang.Doublejava.lang.Boolean | graphvertexedge(user defined attribute where identifier is the string appearing in the UI or key to use with the user array in scripts) |
title | java.lang.String | vertex (entity and group only) |
confidence | com.arciem.FuzzyBoolean | edgevertex (entity only) |
type | java.lang.String | vertex (either “entity” or “junctor”) |
typeid | java.lang.Integer | vertex (entity only) |
completion | java.lang.Double | vertex (entity only) |
efforttime | com.flyinglogic.app.project.FLTimeInterval | vertex (entity only) |
java.lang.Double | entityClassvertex (entity only) (1.0 equals one day) Deprecated. Do not use in 3.0 or later documents. | |
startdate | com.flyinglogic.app.project.FLDate | vertex (entity only) |
enddate | com.flyinglogic.app.project.FLDate | vertex (entity only) |
projectstartdate | com.flyinglogic.app.project.FLDate | graph (calculated with finish-to-start scheduling) |
projectenddate | com.flyinglogic.app.project.FLDate | graph (calculated with start-to-finish scheduling) |
schedulebasis | java.lang.String | graph |
assignment | java.lang.String | vertex (entity only) |
starttime | com.flyinglogic.app.project.FLTimeInterval | vertex (entity only, always calculated for now) |
endtime | com.flyinglogic.app.project.FLTimeInterval | vertex (entity only, always calculated for now) |
utilization | java.lang.Double | vertex (entity only, informational only) |
noteHTML | com.arciem.CDATAElement | edgevertex(styled annotation as XHTML text) |
note | java.lang.String | edgevertex(unformatted version of noteHTML) |
noteNumber | java.lang.Integer | edgevertex |
entityClass | com.flyinglogic.logicgraph.entityclass.EntityClass | vertex (entity only) |
symbol | com.arciem.symbol.Symbol | entityClassvertex (entity and group only) |
weight | java.lang.Double | edge |
backEdge | java.lang.Boolean | edge |
forwardOperator | operator (for edge alwayscom.flyinglogic.logicgraph.operator.MultiplyEdgeOperator) | edgevertex (entity and junctor only) |
color | com.arciem.graphics.ColorRGB | entityClassvertex (group only) |
name | java.lang.String | domainentityClass |
uuid | java.util.UUID | entityClass |
builtin | java.lang.Boolean | domainentityClass |
hidden | java.lang.Boolean | domainentityClass |
edgeWeight | java.lang.Double | entityClass |
showname | java.lang.Boolean | entityClass |
| Value of class | Description of attribute contents |
|---|---|
java.lang.String | Text is a string. |
java.lang.Integer | Text is an integer. |
java.lang.Double | Text is a real. |
java.lang.Boolean | Text is either true or false. |
java.util.UUID | Text is a text-encoded globally unique identifier (GUID); |
com.arciem.CDATAElement | A CDATA node containing XML or XHTML. |
com.arciem.FuzzyBoolean | A fuzzyBoolean element with a required attribute of true with a real value normally between 0.0 and 1.0. |
com.flyinglogic.app.project.FLDate | A date element with a required attribute value of a ISO-8601 date and time in UTC. The time should always be 00:00:00 in this version of Flying Logic. |
com.arciem.symbol.Symbol | A symbol element (see above). Can have just an idCode of “none”, indicating the default symbol for an entity class is being hidden. |
com.flyinglogic.logicgraph.entityclass.EntityClass | An entityClass element (see above). |
com.arciem.graphics.ColorRGB | A colorRGB element with three attributes red, green and blue as real values between 0.0 and 1.0. |
com.flyinglogic.app.project.Workweek | A workdays element. Has three required attributes of rid (resource ID), days (a comma-delimited days of the week as lower-case three-letter abbreviations) and hours (must be 1.0 to 23.0). Can contain event elements that act as exceptions to the work schedule. |
com.flyinglogic.app.project.Resource | a resource element. Has three required attributes: rid (resource ID), name, and cid (calendar ID). Can contain abbr (abbreviation, can be empty) and utilization (value between 0.0 and 1.0, but not 0.0) attributes. |
com.flyinglogic.app.project.FLTimeInterval | an interval element. Contains an ISO-8601 time value; e.g., PT8H0M0S represents a time interval of 8 hours |
Each kind of vertex and edge operator has a unique contained element that has no attributes or contents. The table below lists the single element contained in each operator by class.
| Operator class | Contained element |
|---|---|
com.flyinglogic.logicgraph.operator.FuzzyOrVertexOperator | fuzzyOr |
com.flyinglogic.logicgraph.operator.FuzzyAndOperator | fuzzyAnd |
com.flyinglogic.logicgraph.operator.FuzzyXorVertexOperator | fuzzyXor |
com.flyinglogic.logicgraph.operator.AverageVertexOperator | average |
com.flyinglogic.logicgraph.operator.ComplementVertexOperator | comp |
com.flyinglogic.logicgraph.operator.DistributorVertexOperator | dist |
com.flyinglogic.logicgraph.operator.MaxVertexOperator | max |
com.flyinglogic.logicgraph.operator.MinVertexOperator | min |
com.flyinglogic.logicgraph.operator.MultiplyVertexOperator | multiply |
com.flyinglogic.logicgraph.operator.NegateVertexOperator | neg |
com.flyinglogic.logicgraph.operator.ProductVertexOperator | product |
com.flyinglogic.logicgraph.operator.ProportionVertexOperator | proportion |
com.flyinglogic.logicgraph.operator.ReciprocalVertexOperator | reciprocal |
com.flyinglogic.logicgraph.operator.SumVertexOperator | sum |
com.flyinglogic.logicgraph.operator.SumProbabilitiesVertexOperator | sump |
com.flyinglogic.logicgraph.operator.MultiplyEdgeOperator | multiply |
Thinking with Flying Logic
.png)
Colophon
© 2025 Arciem LLC
Flying Logic® is a Registered Trademark of Arciem LLC
Version 3.2
This work is licensed under a Creative Commons Attribution-NonCommercial-ShareAlike 4.0 International License.
Part I: Introduction
.png)
About This Book
Flying Logic is software that helps people think better. This book, Thinking with Flying Logic, introduces the core techniques that Flying Logic was designed to support. Even if you don’t use Flying Logic, I hope you will find it a concise and useful introduction to some powerful ways you can improve your business and personal life.
Thinking with Flying Logic is companion to two other documents: Welcome to Flying Logic explains why Flying Logic exists, and the Flying Logic User’s Guide explains the details of operating it. To use a travel analogy, Welcome to Flying Logic hopefully got you interested in taking a trip, the Flying Logic User’s Guide taught you how to drive the car, and Thinking with Flying Logic is the road map you will follow to get you where you want to go.
However, Thinking with Flying Logic is not an exhaustive tutorial on the techniques it discusses; in fact it barely scratches the surface. In particular, the Theory of Constraints (TOC) and the TOC Thinking Processes that inspired the creation of Flying Logic are supported by a wealth of literature, books, papers, web sites, courses, conferences, consultants, trainers, academics, implementors, studies, and success stories. I believe that Flying Logic is a much-needed piece of the puzzle, and I urge anyone who reads this book to seek out these other great resources as well.
Keys to Great Thinking
Most of this book is spent on the step-by-step instructions for working with each of the techniques it presents. But in this introduction I want to briefly touch on some ideas, attitudes, and behaviors that I have found create a mind set conducive to effective thinking and communication: these are the ultimate keys to effectively using Flying Logic.
Logic and Emotion
Logic is popularly seen as a cold, complex topic; on par with higher mathematics and invoking images of nerdy professors, science fiction computers and emotionless aliens. But the fact remains that we all think, and we all use logic with more or less skill.
What is not widely understood is that logic is simply the rules for thinking. Just as it is possible (though perilous) to drive a car without knowing the rules of the road, it is possible to think without understanding the rules of logic. These rules are extremely powerful, and fortunately quite simple. But it is unfortunate that as children we are rarely taught to use them as naturally as we learn to read and write. And far from turning us into dispassionate machines, we humans are naturally the happiest and most productive when our emotional hearts and logical minds work together in concert.
Some people resist “being logical” on the grounds that they “just know how they feel” on a given subject. But when we experience strong emotions or gut instincts, it is important to recognize that there are always underlying causes for those feelings. If we merely acknowledge the resulting feelings, and resist a deeper understanding of the causes, we create a disconnect between the rational and emotive parts of our minds. This disconnect results in cognitive dissonance, which is stress resulting from attempting to believe conflicting things or behave in conflicting ways. Cognitive dissonance is a two-edged sword: on the one hand it can help motivate us to change our beliefs for the better (that is, to better reflect reality) while on the other hand it can also lead us to manufacture rationalizations for the way we feel that don’t reflect reality. While both actions quell the discomfort of cognitive dissonance in the short term, rationalizing ultimately leads us deeper into trouble by putting us further and further out of sync with reality.
Attempting to act on feelings alone has another drawback: such actions leave us vulnerable to unintended consequences that our rational minds could have helped us predict and avoid. Of course, it works the other way too: if we try to be “purely rational,” yet ignore strong feelings by discounting their causes, we are also going to create dissonance.
The solution is to get in the habit of bringing the causes (or reasons) that underlie our emotions and instincts to the surface. In doing so, we validate our emotions, and can then integrate them into effective plans.
The good news is that thinking is a learnable skill that improves with practice, and that doing so does not diminish, but rather complements the value of emotions.
Communication and Criticism
We can rarely accomplish anything of significance alone: we rely on other people for many kinds of contributions, and since no one is an island, we must communicate effectively with others: to gain an understanding of their needs, benefit from their experience and wisdom, and negotiate their cooperation.
Often, we are too close to a situation to understand it well; we are embroiled in the situational details and “can’t see the forest for the trees.” When we think we understand a situation well, when we think we already know the all the options and the right answers, this is when inviting others to evaluate and criticize our plans can be the most valuable. Doing so lets “light and air” into our minds and helps us rid ourselves of ways of thinking that have become stale and unproductive.
In The Godfather Part II, Michael Corleone says, “Keep your friends close, but your enemies closer.” Ironically, the most fruitful criticism often comes from people who actively disagree with us. Abraham Lincoln, arguably the greatest United States President, is renowned for having chosen prominent members of his cabinet from those who most vehemently opposed his policies. Whether or not we ultimately agree with our critics, they can often teach us a great deal. The key is to allow our view of the world to change as we learn.
Argument and Honor
When we think of an argument, many of us envision scowls, angry gesticulation, and yelling. We imagine petty name-calling, a parade of unforgiven grievances, and other emotional power plays. Most importantly, we imagine arguing to get our way: to show that we are right and others are wrong. But such an interaction is not an argument, it is a fight. In a fight there may be winners, but there will certainly be losers, and injuries for all.
A real argument is a shared search for truth. In an honorable argument people can still be passionate, but they follow the rules of logic just as drivers follow the rules of the road. And even though people approach a situation from different perspectives and with different preconceptions, the positions they take should be seen as suggestions that are ultimately intended as win-win, even if they initially fall far short. Indeed, even such flat statements as, “We’ll get along fine as soon as you learn to do things my way,” hint at a common objective: getting along.
When argument is viewed as a shared search for truth, it becomes possible to see adapting one’s position to new information and ideas not as weak or wishy-washy, but as a challenge to which only a mature, strong, and honorable person can rise. More pragmatically, all sides can begin to look forward to not merely getting their way, but getting something better in the form of a win-win solution.
Control and Influence
When considering how to cause change, we can imagine ourselves standing at the center of a circle. The things we can reach out and touch directly define our span of control. If all the changes we wish to make are entirely within our span of control, we have the power to simply go ahead and make them.
Usually, however, things are not so simple. In our mental image, the things we control are just what lies within arm’s reach; our span of control is always quite small. But just beyond our span of control lies the start of our sphere of influence. Although we may not be able to reach out and touch these things directly, we can still cause change by cooperating with others. For example, a business may control its manufacturing processes, while it can only influence its suppliers and customers.
The farther away objects are, the less influence we wield, until we reach a point where we have no significant influence. This marks the end of our sphere of influence.
Our sphere of influence is always much larger than our span of control, and is probably larger than we think. Most gratifyingly: causing positive changes within your sphere of influence has the desirable effect of expanding it.
Optimization and Suboptimization
When we reward people for improvements entirely within their span of control, what is the natural reaction? An example of this might be basing manager performance reviews solely on efficiency within their departments. The natural reaction is, of course, for them to narrow their span of control as much as possible, to define its boundaries as sharply as possible from other parts of the system, and to focus entirely on efficiency within their particular component (division, department, cubicle, etc.) This behavior results in suboptimization, which is maximizing or fine-tuning a part of the system without considering the (often detrimental) effects of doing so on the entire system.
On the other hand, what happens when we reward people for improvements within their entire sphere of influence? In this case, their desire becomes to extend their sphere of influence outwards as far as possible. As mentioned previously, acting in one’s sphere of influence requires coordination and cooperation with others, which in turn encourages an awareness of the system as a whole. The end result is optimization, where people orchestrate their efforts together, toward the fulfillment of the system’s goal.
Optimization is the outcome of systems thinking (looking at a system not as merely a collection of parts but as a unified whole) applied to the goal of process improvement.
Tools and Expectations
People have invented many useful tools that help us perceive the world accurately, arrange our knowledge, think about it logically, develop plans, and communicate effectively. Despite having these tools, we must still do the hard work of thinking, and also the hard work of implementing our plans. When new tools (such as Flying Logic) are introduced, they are often touted as labor-saving devices. But do we really do less work now that we have automobiles, telephones, and computers? Arguably, in our world of accelerating change, we often do more. So it is important to have a pragmatic understanding that the net result of new tools is not to reduce labor, but to raise expectations.
Just as spreadsheets were a boon to accounting and financial planning but did not make accountants obsolete, I hope that Flying Logic will be of significant help to systems thinkers and people with a passion for making the world and its systems better. Even more, it is my hope that Flying Logic will help get more people involved in these vital topics.
— Wolf McNally
Part II: The Theory of Constraints Thinking Processes
.png)
Overview of the Theory of Constraints
The Goal
The Theory of Constraints (TOC) is an overall management philosophy originally developed by Eliyahu M. Goldratt and first popularized in his bestselling business novel The Goal. He started with the idea that all real-world systems; whether personal, interpersonal, or organizational have a primary purpose, or goal. The rate at which the system accomplishes its goal is called throughput.
The Constraint
From the idea of throughput, it is easy to see that systems must also have at least one constraint: something that limits the system’s throughput, which can be likened to a chain’s weakest link. If a system had absolutely no constraints, it would be capable of infinite throughput. But though infinite throughput is impossible, amazing throughput gains are possible through the careful identification and management of a system’s key constraints. The purpose of the TOC then, is to give individuals and organizations the tools they need to manage their constraints in the most effective manner possible.
Originally applied to industrial manufacturing lines, TOC principles have been successfully adapted for areas as diverse as supply chain, finance, project management, health care, military planning, software engineering, and strategy.
TOC claims that a real-world system with more than three constraints is extremely unlikely, and in fact usually only one constraint is key. Counterintuitively, this is because the more complex a system becomes, the more interrelationships are necessary among its parts, which results in fewer overall degrees of freedom.
A major implication of this is that managing a complex system or organization can be made both simpler and more effective by providing managers with few, specific, yet highly influential areas on which to focus: maximizing performance in the areas of key constraints, or elevating the constraint (making it less constraining.)
The TOC was originally applied to manufacturing operations, where the constraint was usually a physical constraint: some sort of machine or process that formed a bottleneck in the production line. These sort of constraints are fairly easy to locate. But in the real-world situations where these constraints were broken (i.e. elevated to the point where they were no longer the constraint) it was discovered that the constraints could take on another character: the policy constraint. These are the “ways things have always been done” that ultimately serve to restrict the system’s throughput, and they are usually due to some form of suboptimization: tuning part of a system without regard to the benefit of the whole. Policy constraints are often more difficult to identify and more difficult to manage than a simple machine or physical process, and more powerful tools were invented to do just that.
The Five Focusing Steps
To identify and manage constraints of all kinds, the developers of TOC defined the Five Focusing Steps, which describe a process of ongoing improvement. (Step Zero was later added for additional clarity.)
0. Articulate the goal of the system. How do we measure the system’s success?
1. Identify the constraint. What is the resource limiting the system from attaining more of its goal?
2. Exploit the constraint to its fullest. How can we keep the constraining resource as busy as possible, exclusively on what it can do that adds the most value to the entire system?
3. Subordinate all other processes to the decisions made in Step 2. How can we align all processes so they give the constraining resource everything it needs?
4. Elevate the constraint. If managing the constraining resource more efficiently does not give us all the improvement we need, then how can we acquire more of the resource?
5. Avoid inertia. Has the constraint moved to some other resource as a result of the previous steps? If so, don’t allow inertia itself to become the constraint: go back to step 1.
It is possible that, after iterating through the Five Focusing Steps a few times, that the constraint on the system’s throughput moves entirely out of the system itself, and into the system’s environment. An example of this would be when a manufacturer has more capacity than demand for its products. In this case, further improvement may still be possible, but doing so requires expanding the concept of the “system” to include its customers, the economy, and other factors that were originally just givens of the system’s environment.
The Thinking Processes
The Thinking Processes emerged as TOC practitioners worked with organizations that needed to identify their core constraints and how to manage or elevate them. They needed the answers to three deceptively simple questions:
- What to change?
- To what to change?
- How to cause the change?
The Thinking Processes are based on the scientific method, to which is added a simple visual language, the Thinking Process Diagrams, that are used for describing and reasoning about situations, arguments, and plans using the language of Cause and Effect. There are two basic kinds of reasoning: Sufficient Cause and Necessary Condition.
Sufficient Cause Thinking

Necessary Condition Thinking

The Thinking Process Tools
From the basic Thinking Processes developed several techniques called the Thinking Process Tools designed to answer the three questions. The tools provide the ability to develop a complete picture of a system’s core constraints and how to manage them.
The last of these tools, the Strategy & Tactics Tree, is used in large organizations where it is necessary to create major changes in a short period of time. However, the other five tools are applicable to systems of any size from individuals, to families, to businesses small and large. Like a physical tool kit, you can choose to use individual tools: just the right tool for the job at hand. Or, you can do a larger project where most or all of the tools may be required. When all of the tools are used, the “finished result” of one tool can easily be used as part of the “raw materials” for the next tool. Since improvement is a continuous process, you can use each tool over and over again on every pass through the Five Focusing Steps.
| Tool | Thinking Process | Starting Point | End Result |
|---|---|---|---|
| Current Reality Tree (CRT) | Sufficient Cause | A set of undesirable symptoms | The core cause of the symptoms (constraint) |
| Evaporating Cloud | Necessary Condition | A perceived conflict underlying a constraint | Possible win-win solutions |
| Future Reality Tree (FRT) | Sufficient Cause | A proposed solution | Necessary changes that implement the solution and avoid new problems |
| Prerequisite Tree (PTR) | Necessary Condition | Major objectives and the obstacles to overcoming them | Milestones that overcome all obstacles |
| Transition Tree (TRT) | Sufficient Cause | A set of goals | Detailed actions to achieve the goals |
| Strategy & Tactics Tree (S&T) | Necessary Condition | The highest-level goals of a system | A multi-tiered set of implementation steps |

The Measurement of Success
The last piece of the improvement puzzle is feedback. There needs to be an unambiguous way to measure improvements brought about through the implemented changes. For traditional business, Dr. Goldratt developed three non-traditional measurements that began with the overriding concept of the system’s goal: Throughput (T), Inventory (I), and Operating Expense (OE). It is outside the scope of this book to discuss these in detail, but readers are directed to the TOC body of knowledge for discussions of these measures and how they have been adapted for many different endeavors.
The Categories of Legitimate Reservation
We all want our ideas and plans to make sense. But how do we know that we are making sense? What do we even mean by that? When we use the Thinking Process Tools, we are building a model of the way part of the world works, and in this context our model makes sense if it in does in fact portray a picture of the world that is pertinent and accurate.
To be pertinent, our model must be of that part of the world (our system) that we actually care about in other words our model must have the proper scope. It must not be too detailed in areas that don’t significantly affect the outcome, nor too general, glossing over areas where important details lie. To ensure pertinence, the people who are the main stakeholders in the outcome of the plan must have influence over it.
To be accurate, the cause-and-effect relationships that we model must indeed hold in real life. The Categories of Legitimate Reservation (CLR) are ways to verify the accuracy of a Thinking Process Diagram. They are used to catch common pitfalls in our own thinking and the thinking of others. They are called the Categories because they are well-defined and of limited number. They are called Legitimate because anyone who writes or reads logical statements is always allowed to express them. And they are Reservations because they highlight parts of the diagram that are not completely convincing. Since these reservations are always legitimate, they can be raised, explored, understood, and accepted without anyone feeling like they’re having their toes stepped on. They help everyone keep their emotional distance and stay reasonable.
When you start to work with Thinking Process diagrams, you should deliberately consider the Categories of Legitimate Reservation one by one for each part of your diagram. But as you gain experience you will find you begin to apply them quickly and habitually.
Clarity
If you are creating a Thinking Process diagram by yourself, you probably have a good idea of what you mean. However, you will also probably need to share your plan with someone else sooner or later, and you need to apply the Clarity reservation as the last step before you do. Ask yourself:
- Is the meaning of each part of my diagram clear?
- Is the meaning of my diagram as a whole clear?
Similarly, when someone presents you with a Thinking Process diagram you have never seen before, you should apply the Clarity reservation first by asking yourself:
- Does this diagram really convey what the person presenting it intends?
In Thinking Process diagrams, causes and effects are all represented by entities: rectangles that contain brief statements that are, or could be, true about reality. Flying Logic entities also have a colored bar at the top that designates the entity’s class: the kind of role the entity plays in the diagram of which it is part.
.png)
To satisfy the clarity reservation, the title of an entity must be:
- complete, unambiguous, and grammatically correct,
- in the present-tense, and
- simple in that it contains a single idea with no compound statements.
“Bumped and glass fell and broke,” is an example of a statement that violates all three principles. This idea should probably be expressed as three separate entities, each related to the next by a causal connection:
.png)
The causal connections between the entities must also be clear, with each step from entity to entity having a natural and obvious flow for any stakeholder who reads the diagram. Reading from one entity to another via an edge (also called an arrow) will follow one of two patterns, or Thinking Processes. Which Thinking Process is used depends on what kind of diagram you are working with; but within a single diagram, the meaning of the edges does not change.
- Sufficient Cause Thinking: “If A then B.” or “A is sufficient to cause B.”
This pattern expresses the idea that the existence of A is, by itself, enough to cause the existence of B. Sufficient Cause Thinking is used by the Current Reality Tree, Future Reality Tree, and Transition Tree.
.png)
- Necessary Condition Thinking: “If not A then not B.” or “A is necessary to obtain B.”
These patterns express that A must exist for B to exist, but may not be sufficient by itself. Necessary Condition Thinking is used by the Evaporating Cloud and Prerequisite Tree.
.png)
Notice that in both illustrations, the edge (arrow) looks exactly the same although the meaning is different. How you read an edge depends on which Thinking Process was used to construct the diagram.
Entity Existence
This reservation asks whether an entity in the diagram is true now. In a Current Reality Tree, for instance, every entity in it should describe something that is true now. A Future Reality Tree or Transition Tree, however, can contain a mix of entities that are either true now, or would be expected to become true under certain conditions. This reservation is a warning to “check the facts” before making an untrue assertion about reality.
.png)
Causality Existence
This reservation asks, “Does A really cause B?” Often we associate two ideas because they are correlated, that is, they are often found in proximity to each other. However, to actually say that one thing causes another requires much stronger evidence.
.png)
Cause-Effect Reversal
A special case of the Causality Existence reservation is Cause-Effect Reversal. In this case, we question whether the edge is pointed in the right direction.
.png)
Indirect Effects
Other times, an entity is an indirect effect of a cause, but important necessary steps are missing.
.png)
Back Edges
In cases where it seems ambiguous as to which entity is the cause and which is the effect, it may be a good place to look for a self-reinforcing loop. Flying Logic can model self-reinforcing loops using back edges. A back edge is added whenever you attempt to create a new edges that indirectly makes an effect to be its own cause. Back edges are drawn thicker than regular edges.
.png)
Insufficient Cause
This reservation asks, “Is A, all by itself, sufficient to cause B? What else might also be necessary?” Usually a combination of factors outside our control (“Preconditions”) and factors that we influence or control (“Actions”) must combine to create a particular effect. In diagrams based on Sufficient Cause Thinking, this is modeled using a junctor that contains the AND operator. Junctors are easily created by dragging from an entity to an existing edge.
.png)
When looking for insufficient causes, we should also keep in mind that a list of causes can also be too sufficient, or in other words, include causes that are actually not required to produce the effect. So we should also ask, “Have we listed anything as necessary that really isn’t?”
.png)
Additional Cause
Once we have identified one sufficient cause for an effect, we are often tempted to move on, and in doing so we may overlook other causes that may either be independently causing the effect, or mutually intensifying it. This reservation asks, “Have we identified every cause of A? What else could also be causing A?”
.png)
Predicted Effect
How can we increase our certainty that a cause we have identified is really the cause of the effects we are inclined to believe? For example, let’s say I come from a walk and discover my wallet missing. One of the first things that might pass though my mind is that my house has been robbed. But has it been robbed?
.png)
Usually a cause is responsible for more than one effect, and this reservation asks, “If A is true, what other effects in addition to B would we expect to see?”
.png)
If the additional predicted effects are also observed, then we can be more confident in the causality we initially identified. But if the predicted effects are not observed, then we may be well advised to look for additional causes.
.png)
Tautology
People sometimes don’t examine their beliefs very closely, and will, when asked for a cause, often re-state the cause using different words. Even though you will almost never encounter tautology (also called circular reasoning or begging the question) in a Thinking Process diagram, you will encounter it in casual conversation. Some examples:
- “You can’t give me a C for this course, I’m an A student!”
- “My homework is boring because it’s so tedious.”
- “Mayor Green is the most successful mayor ever because he’s the best mayor in our history.”
- “The defendant shows no remorse, and this fact should strengthen your resolve to find him guilty!”
Current Reality Tree
When a non-trivial system (a for-profit business, a non-profit organization, a department, or a personal relationship to name a few examples) needs improvement, it is often not clear what to change, even to people who have a great deal of experience with the system’s workings. This is because systems contain many cause-effect relationships that interrelate in complex ways, and understanding the system sufficiently to decide what to change is often even more problematic because the people with experience often have only a narrow view of the parts of the system they interact with.
The Theory of Constraints (TOC) is based on the idea that all systems have a goal, or reason for existence. The rate at which a system can achieve its goal is called its throughput. The TOC also says that all systems have core drivers, which can be physical constraints, policy constraints, market constraints, or some combination of those, that have a major impact on the entire system and that ultimately (albeit indirectly) govern the system’s throughput. Ironically, the more complex the system, the fewer core drivers it is likely to have, due to the greater number of interdependent cause-effect relationships such systems contain.
The Current Reality Tree (CRT) is a tool for discovering the system’s core driver, which is also known as the constraint. The constraint is the cause that is most common to the most severe symptoms the system is experiencing, and thus the constraint must be managed most carefully in order to most dramatically improve throughput. By focusing on the constraint, you will realize the most “bang for your buck.”
Flying Logic Setup
A CRT is based on Sufficient Cause Thinking, and this is how Flying Logic documents are set up when first created, so you do not need to do anything special with the Operators popup menus to start creating your CRT. Most CRTs are drawn with root causes at the bottom and the symptoms at the top, so you may want to use the Orientation popup menu to change the orientation of your document to Bottom to Top.
.png)
CRTs are created using the entity classes in the built-in Effects-Based Planning domain, and primarily use the following classes: Un-Desirable Effect, Precondition, and Intermediate Effect. CRTs are most often used to pinpoint problems, but can also be used to identify core strengths, in which case the Desirable Effect class can also be used.
.png)
Step 1: Understand the Scope
Before you can document how your system works and where its problems lie, you need to make sure you have a clear understanding of what you mean when you talk about your system. In other words: what are you analyzing?
Spend the time necessary to reach a clear, written understanding with other stakeholders:
- What is your system’s goal?
- What are the necessary conditions for knowing the goal is being achieved?
- What measures do you use to use to know how well the necessary conditions of the goal are being met?
- Where do the boundaries of your system lie?
- What greater system is your system a part of?
- What systems does your system interact with?
- What are your system’s inputs and outputs?
Step 2: List the Symptoms
Presumably, you are doing your analysis because you believe the system would benefit from improvement, and because you see evidence of this potential benefit in various problems or symptoms of trouble. Such symptoms could be low profits, low customer satisfaction, or lots of arguments among family members. These symptoms are known in TOC as Un-Desirable Effects or simply UDEs.
Usually there are between 5 and 10 UDEs that are causing the most difficulty in the system, and it is these UDEs that should be added first. Give each UDE a simple, present-tense title that is intended to be clear to any stakeholder, and make sure that the UDEs you choose at this stage are uncontroversial as to their actual existence. In other words, any stakeholder who looks at this list should have no difficulty agreeing, “Yes, these are some of the most serious problems we have.”
.png)
Step 3: Connect the Symptoms
Undesirable Effects are often contribute to other problems. As you study your list of UDEs, you will notice that some are probably direct or indirect causes of others already in your list. If this is the case, then connect these entities with edges (arrows) from the causes to the effects. Don’t be too concerned at this stage if the causes are not directly responsible for the effects: as you grow the tree, you will add other entities that complete the picture.
.png)
Sometimes you will notice that a single cause contributes to more than one effect, as is the case with D, below.
.png)
Other times you will notice that an effect has more than one independent cause, as is the case with B, above. When a Flying Logic document is set up for Sufficient Cause Thinking, more than one arrow entering an entity denotes more than one sufficient, independent cause. This is also called an OR relationship.
Often, a single cause is necessary, but not sufficient by itself to cause an effect. This is denoted by an AND junctor, which is created by dragging from the cause entity to an existing edge.
.png)
Step 4: Apply the Categories of Legitimate Reservation
The diagram as it stands is probably only an extremely rough picture of your system. By applying the Categories of Legitimate Reservation, you now add additional entities and causal relationships that create a true picture of the situation. In particular, look to add additional causes for the effects you have identified, and identify insufficient causes and add their necessary conditions. Also review your diagram for clarity, and step through it using Flying Logic’s confidence spinners. You can even change the class of an existing entity if, for instance, an entity that you originally added as an UDE now appears more neutral in context.
.png)
Use these guidelines to help you choose what class of entity to add:
- If an entity is undesirable on its face— in other words, if the system would definitely be better off without it— then use the Un-Desirable Effect class. UDEs can have predecessors, successors, or both, but should always have at least one causal connection into a completed diagram.
- If the entity is neither negative nor positive, but exists merely due to the larger context in which the system must operate and is something over which you have no significant influence, then use the Precondition class. Preconditions should never have predecessors, and should always have at least one successor.
- If the entity is neither negative or positive, but exists because of something within your control, then use the Action class. Actions are always causes and never effects, so they will have successors but no predecessors.
- If the entity is neither negative nor positive, but it exists as a consequence of other causes in the diagram, use the Intermediate Effect entity class. In a completed CRT, Intermediate Effects should always end up with both predecessors and successors.
Step 5: Continue Adding Underlying Causes
At this stage, you may have several unconnected, or loosely connected clusters of entities. In this step, search for and add deeper causes for the effects in your diagram, looking in particular to add causes that tie two or more clusters together. Of the causes that are currently at the root of your diagram, keep asking yourself, “Why is this happening?” and make your answer take the form of additional entities and the edges that connect them. Alternate between adding underlying causes and applying the Categories of Legitimate Reservation from the previous step.
.png)
Step 6: Consider Negative Reinforcing Loops
Although it is uncommon, sometimes the presences of an UDE at a higher level in your system actually aggravates UDEs at a lower level. Since this situation is so serious, it is important that you note it in your diagram as a causal loop, also known as a vicious circle.
Normally, all edges in a Flying Logic document “flow” from the start of the document (the root causes) to the end (final effects.) When you attempt to add an edge that would create a loop (that is, an effect indirectly becoming its own cause) Flying Logic creates a special back edge that denotes a causal loop. Back edges are thicker than regular edges.
.png)
Back edges differ from regular edges in two ways: They do not have edge weights, and they do not participate in the flow of confidence values through the documents. They can, however, be annotated like other edges.
Step 7: Identify Root Causes
As your CRT becomes more complete, you will notice that one group of causes lie at its “root.” That is, they have successors but no predecessors. Some of these causes will be Preconditions and others may be UDEs, and they won’t necessarily appear at the bottom of the diagram. In the illustration above there are nine root causes.
The purpose of this step is to make sure you have built down your tree to the point where you have uncovered the deepest causes over which you have some control or influence. Preconditions are by definition out of our control, but you should question whether the preconditions at the root of your CRT aren’t really Intermediate Effects with other underlying causes. Also question whether the UDEs at the root of the tree don’t have additional underlying causes that you also control. The idea is to “uproot” problems at their deepest possible level.
Step 8: Trim the Tree
At times you may discover that parts of the tree you have built have little or no connection, as successors or predecessors, to the UDEs you care about. To keep the tree manageable, you should remove these clusters from view by either
- Deleting them,
- Using Cut and Paste to move them to a different document, or
- Placing them into a group which is then collapsed.
Step 9: Identify the Core Driver
If you have constructed your CRT rigorously observing the rules of cause and effect, you will agree that eliminating a root cause will also cause a chain reaction of other problems being eliminated. If this doesn’t appear to be the case, go back and make sure that at each step in the diagram, you have identified and added all the necessary and sufficient causes of your UDEs (Step 4), and that you have built the tree down as far as possible to root causes that you control or influence (Step 5.)
The time has come to identify the single cause that has the most influence over the most critical UDEs in your CRT. This single cause is the Core Driver (also call the constraint, or the bottleneck): the cause that must be managed or eliminated in order to break through the boundaries that hold your system back.
Although your CRT may contain several root causes, all of which may eventually need attention, you can find the Core Driver by judging several factors for each root cause:
- How many UDEs they indirectly cause,
- How severe are the UDEs they indirectly cause, and
- How much control or influence you have over them.
To aid in your analysis, you can select one of your root causes and select Edit ➡ Select Successors. Alternatively, you can select one of your effects and select Edit ➡ Select Predecessors. Use this technique to quickly get an idea of how influential each of your root causes are, although you will still need take the severity of the UDEs into account.
In the illustration below, entity G has been selected along with its successors, which makes it obvious that it contributes in some way to every UDE in the diagram. Since all of the causes in the diagram are at least within our influence, we conclude that G is our Core Driver: it is the constraint on which we must focus.
.png)
Evaporating Cloud: Conflict Resolution
Arguments. Fights. Politics. Enemies. Compromise. Loss.
We have all encountered conflict, and most of us try to avoid it whenever possible. Conflict is seen as unhealthy and unpleasant to the point that many people will attempt to ignore it even after realizing that doing so may actually be contributing to a worsening situation. Or both sides treat the conflict as a zero-sum game: “Either I go, or he goes!” Or perhaps worse, both sides compromise: they “split the baby” and nobody goes away happy.
It turns out there are better ways to resolve conflicts: ways that result in the creation of solutions that completely satisfy everyone involved. From one remarkable perspective, it is even possible to entertain the idea that conflicts don’t actually exist except at the superficial level of our positions: what we say we want.
When two wants appear to be mutually exclusive, we say there is a conflict. The way forward is to recognize that our wants (also called positions) are motivated by underlying needs (also called requirements.) For example, the two wants could result from children fighting over a toy: in this case they both want to possess the same limited resource. However, they are motivated by underlying needs, which may not be the same for each of them: one child may feel the need to assert their ownership of the toy, while the other child may feel the need to incorporate the toy into their play. Furthermore, the children are united in a common objective: to get along and have fun. To achieve this common objective, satisfying both children’s needs is necessary. Notice that as we have passed beyond the boundary of the apparent conflict presented by their wants, a recognition of their needs and common objective begins opening the door to creative solutions that may leave everyone happier than they thought possible.
When the connection is made that conflict stems not from some kind of pathology, but from legitimate needs and common objectives, it becomes obvious that the best approach is not avoidance but prompt communication and the creation of options for mutual gain.
Often, after producing a Current Reality Tree (CRT), it is possible to recast the Core Driver as a Core Conflict, containing two mutually exclusive positions. So whenever we find ourselves faced with conflicting wants, which often happens as the result of creating a CRT, but even more frequently just happens on its own, the Evaporating Cloud is the tool to use. (It is so-called due to its ability to “evaporate” conflict. It is also known as the Conflict Resolution Diagram.)
Flying Logic Setup
Since the basic form of a Cloud is always the same, the easiest way to start a Cloud is to select the File ➡ Open Examples... command and open the included template file Cloud.logic-t template located in the Documents/Conflict Resolution folder. Template files open as new, untitled documents to which you can make changes and save without fear of accidentally changing the template file itself.
The following paragraphs describe how to set up a Cloud document from scratch. You can skip to the next section if you are using the template.
A Cloud is based on Necessary Condition Thinking. Since Flying logic documents are set up for Sufficient Cause Thinking by default you will want to set the Operator popup menus as follows:
- Entity Operator: Fuzzy And (AND)
- Default Junctor Operator: Fuzzy Or (OR)
Clouds are read from left-to-right, starting at the Common Objective. However, this means the flow of the edges (arrows) must be towards the Common Objective or right-to-left: so you will want to set the Orientation popup menu to Right to Left.
.png)
Clouds are created using the entity classes in the built-in Conflict Resolution domain, and use the following classes: Want, Need, Common Objective, Conflict, and Solution.
.png)
If you’re using the template mentioned above, then the diagram is already drawn for you; you only need fill in the text. But the steps below assume you are drawing a cloud from scratch.
Step 1: Identify the Wants
Create two Wants entities and give them titles that succinctly summarize each of the conflicting positions. Traditionally the two Wants are called D and D’ (“D Prime”).
.png)
Step 2: Identify the Conflict
Create a single Conflict entity and make it a predecessor of each of the two Wants. If you’re using the right-to-left orientation typical of Clouds, the Conflict entity will be to the right of the Wants.
Give the Conflict entity a title that summarizes why the Wants conflict.
.png)
Finally, right-click (Mac or Windows) or control-click (Mac) one of the two edges leading from the Conflict entity and select Set Selected Edge Weights: Negative in the popup menu that appears. This causes the edge you negated to turn red. By doing this, our model accurately reflects the mutually-exclusive nature of the two wants. To see this, click the Show Confidence Spinners switch in the toolbar, then adjust the spinner on the Conflict entity from its maximum (True) to is minimum (False). You will see how the spinners on the Wants entities cannot both be true at the same time, due to the negated edge.
.png)
Step 3: Identify the Underlying Needs
Create two Needs entities, each one a successor to one of the Wants entities. The purpose of a position is to fulfill an underlying need. Give each need a title that summarizes the immediate need that its side in the conflict is trying to fulfill by asserting its position (the Want.)
The difference between a Need and a Want is simple: fulfillment of Needs are conditions considered necessary to fulfilling the overall objective, while Wants are particular actions chosen to fulfill the needs.
.png)
Step 4: Identify the Common Objective
Create a single Common Objective entity, and make it a successor of both needs. In a left-to-right orientation, the Common Objective will be the left-most entity in your diagram.
If the two sides in the conflict have no common objective, then there isn’t really any conflict because the two sides could simply go their separate ways: they have no reason to cooperate. Thus, in every situation identified as a conflict, there is always a common objective. The Needs identified in the previous step are both considered necessary to achieving the common objective. In other words, both sides of the conflict would agree that unless their needs are met, the common objective cannot be met.
The Common Objective is also usually at a “higher level” than the Wants or the Needs. In the case of the children fighting over a toy, the Common Objective might be for them to “get along and have fun.” Notice that this Common Objective doesn’t mention the specific toy that is the subject of the conflict, even though the Wants and Needs may all mention it.
.png)
Step 5: Ensure Clarity by Reading the Diagram
Now that the diagram is complete, show the Confidence Spinners, and note that there is only one driver: the Conflict entity. This is the only entity that has no predecessors. If you have set up the document operators and negated one of the edges coming out of the Conflict entity as described above, you will see that by changing the value of the Conflict entity’s spinner, one Want or the other can be satisfied (by becoming True), and yet the Common Objective can never become True. In other words, as long as the conflict exists, the Common Objective cannot be achieved.
.png)
Now read and revise the diagram for clarity and accuracy. Clouds are read from left to right, against the flow of the edges, using the pattern:
- “In order to satisfy the need we must obtain our want.”
This is the basic pattern of Necessary Condition Thinking. This pattern applies to all the edges except the two coming from the Conflict entity. Once we have completed this step, we fix or clarify the wording.
Step 6: Identify and Validate Assumptions
In the pattern from the previous step, there are two blanks for needs and wants. In this step we add a third blank:
- “In order to satisfy the need we must obtain our want because of our assumptions.”
Our assumptions are why we must obtain our want, and finding erroneous assumptions is the key to breaking the conflict. Assumptions “hide” underneath the Want→Need edges, and the Needs→Common Objective edges. There are also assumptions that underlie the Conflict entity itself: why we believe we can’t have both Wants simultaneously.
As you surface these assumptions, use Flying Logic’s annotation feature to add text to each of the four dependency edges and the Conflict entity. Take as much space as you need to describe each assumption, and begin each assumption with “...because”.
.png)
Sometimes there will be a single assumption under each edge, but often there will be several. Assumptions can be either valid or invalid. Invalid assumptions are often used to link needs to wants, but here you must critically evaluate each of the assumptions to determine their validity. Invalid assumptions can be eliminated, leaving just the valid ones.
Step 7: Propose Solutions
If we manage to invalidate all the assumptions on any of our edges, then we have eliminated the necessary condition relationship between two of the entities. If we have invalided all the assumptions on the Conflict entity, then we have eliminated the perception of conflict itself. In either of these cases, the Cloud has “evaporated” and we have discovered there is, in reality, no conflict.
If the cloud is still intact, then we have at least one valid assumption in the five locations. The final step is to construct solutions (also called injections) that let us “break” one or more of the edges in the Cloud. A solution is an “option for mutual gain,” and the most constructive place in the cloud to find creative solutions is in the edges that connect the Wants to the Needs, by asking questions of this pattern:
- “How can we satisfy Need without obtaining Want?”
- “How can we accomplish Common Objective without satisfying Need?”
- “How can we obtain both First Want and Second Want?”
Remember that solutions that you come up with at this stage should not be considered final unless the situation you are analyzing is rather simple; this tool is for brainstorming a new set of options. You can use a Future Reality Tree to solidify the ideas you generate at this stage. Also, avoid the temptation to look for a single “panacea” solution; you will often need two or more injections to implement a truly win-win solution.
To inject a solution into the diagram, first select the edge where you want the solution to appear then either:
- Double-click the Solution entity in the class list in the sidebar.
- Right-click (Mac or Windows) or control-click (Mac) the edge and select New Entity ➡ Conflict Resolution ➡ Solution from the popup menu that appears.
An OR junctor will be inserted into the edge, and the new Solution entity will be added as a predecessor. Give the new Entity a title that summarizes the solution.
.png)
More solutions can be added to the same edge by selecting just the junctor, then using the same command from the popup menu.
By displaying the Confidence Spinners, you will see that you now have additional points of control for every solution you have added, and that it is now possible to make the Common Objective True, even if both Wants (the original positions) are not obtained.
.png)
Future Reality Tree
Perhaps you have a system you want to improve, and you’ve done a Current Reality Tree to identify What needs to change. Perhaps you’ve also done one or more Clouds to create some potential win-win solutions, in other words What to change to. But...
- How can you be confident which of those ideas will work?
- How do you pick one idea over another?
- How do you know something important hasn’t been ignored or overlooked?
- What are the solution’s strengths, and how can they be maximized?
- How can you be confident the “solution” won’t have unanticipated effects that leave you in a situation that’s worse than before?
- Are a potential solution’s shortcomings something we can live with, something we can fix after the fact, or something we should avoid at all costs?
It is the job of the Future Reality Tree (FRT) to help you answer these questions.
The FRT is easiest-understood by contrasting it with the Current Reality Tree (CRT):
- To build a CRT, start with a set of Un-Desirable Effects (UDEs), and build down to the Core Driver, from which we invent Solutions (also called injections.)
- To build a FRT, start with a potential Solution (injection), and build upwards to a set of Desirable Effects (DEs).
FRTs can be built not only from a previously-conceived Solution, but also from other parts of previously-created CRTs and Clouds.
Flying Logic Setup
An FRT is based on Sufficient Cause Thinking, and this is how Flying Logic documents are set up when first created, so you do not need to do anything special with the Operators popup menus to start creating your FRT. Most FRTs are drawn with one or more proposed Solutions at the bottom and the Desired Effects at the top, so you may want to use the Orientation popup menu to change the orientation of your document to Bottom to Top.
.png)
FRTs are created using the entity classes in the built-in Effects-Based Planning domain, and primarily use the following classes: Desirable Effect, Un-Desirable Effect, Precondition, Intermediate Effect, and Action. If starting with solutions created from a Cloud, then FRTs will also often use the Solution class from the Conflict Resolution domain.
.png)
Step 1: State the Proposed Solution and Desired Effects
Create one or more Solution entities to identify the set of injections you plan to implement. These injections may come from a Cloud you’ve already created, and you can use the Copy and Paste commands to easily add these entities to your FRT document.
Also create one or more Desirable Effect entities that summarize the outcome you are working towards.
You may wish to temporarily group these two sets of entities to keep them separate; the purpose of the FRT is to fill in the “middle”.
.png)
Step 2: Add Other Elements Already Developed
If you have already created a CRT, look for Precondition entities (statements about existing reality) that may be needed in your FRT. You can use the Copy and Paste commands to easily transfer them from your CRT to your FRT.
If you are working from an existing Cloud, also copy over the Common Objective and any of the Needs entities that the proposed Solutions are intended to satisfy.
You may wish to group the entities you’ve added in this step, as they represent entities that will end up in the “middle” of your FRT.
.png)
Step 3: Fill In the Gaps
Starting with your Solution entities, add entities that represent the direct, inevitable consequences of those injections being put into place. Use Un-Desirable Effect entities for negative consequences, Desirable Effect entities for positive consequences, and Intermediate Effect entities for neutral consequences.
.png)
Use the Categories of Legitimate Reservation, to check your causal connections. If the consequences you add are not sufficient by themselves, then make sure you add any Precondition entities, or tie in any other entities that express the other necessary conditions (AND relationships) needed to produce the predicted result. Feel free to move objects between groups or ungroup the entities when the edges start to give your document structure.
.png)
Continue advancing from the effects you’ve identified to additional effects, evaluating whether the subsequent effects are bringing you closer to any of your Desirable Effects, or the Common Objective or Needs entities you may have added from your Cloud. If they do not, continue adding and evaluating effects you may not have previously considered.
.png)
If your progress slows down or stops, then consider additional Action entities you might add. These Actions are also injections, but to differentiate these injections from those that are part of your original solution, use the Action entity class instead of the Solution entity class you started with.
.png)
Step 4: Read and Verify the Tree
Once you have made connections to all of your Desirable Effects, re-read the entire diagram. Remember that FRTs are created using Sufficient Cause thinking, so the basic pattern you will use when reading is:
- If cause A then effect B.
When two or more arrows enter an entity, we have multiple sufficient conditions, also called an OR relationship:
- If cause B or cause C then effect D.
When two or more arrows enter an AND junctor, then we have multiple necessary conditions:
- If cause E and cause F then effect G.
Pay careful attention to the Categories of Legitimate Reservation. Make sure every statement in your entities and those implied by the causal relationships are clear and logical.
When reading through the diagram, it is also a good idea to display the Confidence Spinners and use them as an aid to checking your logic.
- Display the Confidence Spinners by clicking the Confidence button in the toolbar or selecting the View ⇐ Confidence command
- Set every spinner to indeterminate by using the Entity ⇐ Reset Confidence command.
- Because Preconditions are supposed to be facts about the world, set each Precondition entity’s confidence value to True.
- Notice that your Solution by itself is sufficient to cause additional effects, so set its confidence value to True and notice how those effects become true.
- Notice that some of your Actions are “paired up” by AND junctors with other entities that are now True. These Actions are eligible for execution, while other Actions that are paired up with any entities that are not already True are ineligible for execution: they must wait until the other necessary conditions become True.
- Continue step-by-step through the diagram, telling yourself the “story” of the diagram as you set each Action to True when it becomes eligible, until your Desirable Effects also become True. Correct any errors you discover in your logic along the way.
.png)
Step 5: Build In Positive Reinforcing Loops
Recall that when building a Current Reality Tree, occasionally there are Un-Desirable effects that are so severe that they “feed back” on others and create negative reinforcing loops. When creating a FRT, you want to look for opportunities to do the opposite: build in positive reinforcing loops. If you can do so, you are more likely to create a solution that is self-sustaining.
Look for Desirable Effects that may intensify effects lower in the tree that lead back to one or more Desirable Effects. If you find such cases, annotate them using Back Edges. Pay close attention to where you might need to add additional Actions in order to create sufficient cause for a positive reinforcing loop’s existence.
.png)
Step 6: Seek and Address Negative Branches
This is a critical step. Whether or not you’ve already added some Un-Desirable Effects to your FRT, now is the time to go back over it and carefully search for other UDEs that are consequences of any of the entities we have added.
Once you have done that, look for the earliest places in the causal chain where UDEs start to appear. These “turning points” are the start of Negative Branches. It is critical that you deal with Negative Branches in order to avoid creating worse problems than those you set out to cure.
.png)
There are two approaches to addressing Negative Branches: Reactive and Proactive.
In the Reactive approach, UDEs are allowed (perhaps even expected) to occur, but are deemed unavoidable. New Action entities (injections) are then paired with the UDEs (along with other entities as necessary) to cause additional effects that mitigate the UDEs. These additional effects are hopefully Desirable Effects, but can also be neutral Intermediate Effects.
In the Proactive approach, alternative injections are created that achieve the next stage of Intermediate Effects that are on the path to the final Desirable Effects, without causing the UDEs. This is also known as “trimming the Negative Branch.”
In the illustration below, we deal with one Negative Branch proactively by discarding one of our original Solution entities B and devising an alternate course of action Y. The other negative branch is handled reactively by devising a new Action AA that mitigates the UDE S if and when it occurs.
.png)
Once a better path has been created, it is a good idea to keep a record of the entities that participated in the Negative Branch by keeping them in collapsed groups, instead of deleting them.
When someone brings you a well-intentioned proposal that you have concerns about, it is good practice to ask for some time to think about it, then take their proposal and construct a FRT with their suggestion as the initial injection at the root, and with the Desirable Effects predicted by the suggester and the UDEs you foresee as the final outcome. Once you have this FRT, you can discuss it in detail with the suggester. If you or they can develop injections that address the UDEs, then you are likely to have a proposal you can approve.
.png)
Prerequisite Tree
Perhaps you’ve gotten a picture of your Core Drivers using a Current Reality Tree (CRT). You may have used a Cloud to come up with some promising solutions and used a Future Reality Tree (FRT) to develop a solution you think will work. But unless your situation is quite simple, you’re not done yet. One of the most overlooked aspects of planning lies in determining the things we need but don’t have yet: these are the obstacles that lie in our path. And as we develop ways to overcome these obstacles, further obstacles will often become visible. The Prerequisite Tree (PRT) is a tool that helps us to identify and see beyond every obstacle, and make sure that every necessary activity is included in our plan.
Flying Logic Setup
A PRT is based on Necessary Condition Thinking. Since Flying logic documents are set up for Sufficient Cause thinking by default you will want to set the Operator popup menus as follows:
- Entity Operator: Fuzzy And (AND)
- Default Junctor Operator: Fuzzy Or (OR)
PRTs are usually read from top-to-bottom, starting at the Objective(s). However, this means the flow of the edges (arrows) must be towards the Objective(s) or bottom-to-top: so you will want to set the Orientation popup menu to Bottom to Top.
.png)
PRTs are created using the entity classes in the built-in Prerequisite Tree domain, and use the following classes: Objective, Overcome, and Milestone.
.png)
If you have already constructed PRTs in the past, the choice of Overcome instead of Obstacle as an entity class name may seem a little strange at first. We use the two terms somewhat interchangeably, but the name Overcome was chosen for three reasons:
- First, the choice of Overcome makes the tree more natural to read. For example, this simple sequence can be read, “In order to obtain A, it is necessary to overcome B. In order to overcome B, it is necessary to obtain C.”
.png)
- Second, when using the Confidence Spinners to step through the logic of the tree, we use True to indicate that the statement in the title of the entity exists or otherwise pertains to reality, and False to indicate that it does not pertain. If we used the class name Obstacle, then a True confidence value would indicate the existence of the obstacle. However, what we want to express is the exact opposite: when all the necessary conditions are met, we want a confidence value of True to indicate that the obstacle no longer exists: it has been overcome. So when dealing with Overcome entities, it is easy to think of False meaning, “We have not yet overcome this,” (the obstacle exists) and True as meaning, “We have overcome this” (the obstacle no longer exists.) Thus, if every entity in our PRT does not have a Confidence of True, it is easy to see at a glance what we still need to accomplish.
.png)
- Third, there is a positive connotation to calling these entities Overcome. The name helps convey the idea that all obstacles contain the seeds of their downfall, and focuses the planner on the obstacle not as something that exists to thwart them, but rather as something that exists to be thwarted.
Step 1: Identify the Objective
Create an Objective entity and give it a title that uses simple, present-tense wording. Usually PRTs will have a single Objective entity that defines the outcome that you are working to achieve, although they can contain more than one Objective if they are closely related. Often the wording of the Objective will be drawn from an injection (Solution entity or Action entity) you used in creating a Future Reality Tree.
.png)
Step 2: Identify Some Obstacles to Overcome
Something stands in the way of achieving your Objective, or you probably would have done it already. Create a set of Overcome entities that represent the nonexistent necessary conditions for achieving your Objective. The point here is not to list everything you will need to do to achieve your Objectives, but to identify the things you still lack. Connect each Overcome entity as a predecessor of your Objective.
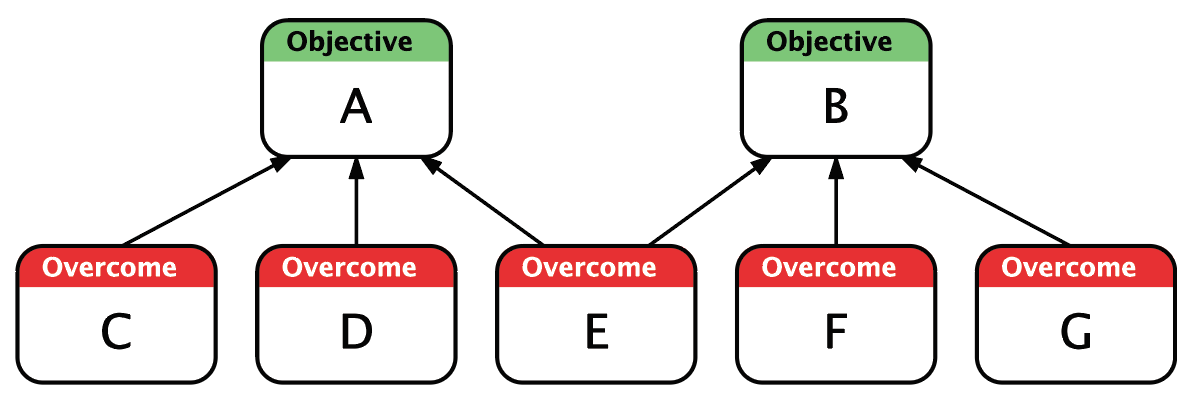
Step 3: Brainstorm Milestones
Consider each of the Overcome entities you have added and brainstorm one or more Milestone entities that will negate the obstacles. It is useful to remember that you don’t need to completely destroy an obstacle to get past it: you can (figuratively) go around it, over it, or under it; the point is to be creative.
- Often there will be a single Milestone matched with each Overcome. (M is necessary to overcome G.)
- Some of the Milestones you identify may Overcome more than one obstacle. (J is necessary to overcome D and E.)
- Other times, your brainstorming will come up with two or more alternatives that may be able to Overcome an obstacle. You use OR junctors to model this. Junctors are easily created by dragging from an existing entity to a line. (Either H or I are necessary to overcome C.)
- And sometimes, more than one Milestone will need to be achieved in order to Overcome an obstacle. (K and L are necessary to overcome F.)
.png)
Step 4: Continue to Deepen the Tree
Now consider each of the Milestones you added in the last step. What obstacles to implementing them present themselves? Lack of knowledge? Lack of manpower? Lack of money? Creating a PRT is focused on finding those Necessary Conditions that you currently lack; this is all an obstacle really is. For each such obstacle you identify, create a new Overcome entity and connect it as a predecessor to the appropriate Milestone. For each of these new Overcome entities, devise Milestones that address them, and so on.
As you deepen the tree, the Milestones you add will start to have a smaller, more tractable character. At some point you will add Milestones for which you are unable to find any significant obstacles to their implementation. These Milestones are the roots of your PRT, and represent the accomplishments that must be tackled first. Of course, there may be many actual Actions that are required to implement a Milestone, and this is the subject of the Transition Tree discussed in the next chapter. But for now, it is sufficient to identify Milestones that entail no significant obstacles.
.png)
Step 5: Read and Verify the Tree
Once you feel that your tree is well-connected from its simplest Milestones all the way through to the ultimate Objective, it is time to carefully read the tree for clarity and completeness. Since PRTs are constructed using Necessary Condition thinking, the tree is read against the flow of the edges starting with the Objective. Each step of the tree is read with one of the following patterns:
- In order to obtain A it is necessary that we overcome B.
- In order to overcome B it is necessary that we obtain C.
Make sure that you apply the Categories of Legitimate Reservation as you read through the tree. Ask yourself questions such as:
- Do we really need to overcome this obstacle?
- Is there a way to avoid having to overcome this obstacle?
- Does the milestone really overcome the obstacle?
- Are there any other milestones required to overcome the obstacle?
- Are there any other milestones that are also sufficient to overcome the obstacle?
It is also a good idea to use Flying Logic’s Confidence Spinners at this stage to go through your diagram step by step with the flow of the edges from the root Milestones all the way to the Objective.
Step 6: Trim and Finalize the Tree
Once you have verified that your PRT is logically sound, it may contain one or more alternate Milestones (connected by OR relationships) that you can now choose among. Trim the rejected alternatives either by deleting them or placing them within collapsed groups.
Transition Tree
Once you have identified the obstacles that stand in the way of achieving your goal and developed milestones that will overcome them, you need an execution plan: a set of actions that combine step-by-step to bring your system inexorably closer to its goal. Others who read your plan (and ideally participated in its creation) should be able to clearly see how every action, and particularly the actions in which they play a role contribute to the benefit of the entire system. This is the key to creating buy-in: a shared vision that yields enthusiastic cooperation. The Transition Tree (TRT) is an effective tool for creating an execution plan that creates a transition from the current reality to a future reality.
Although a Transition Tree is related to the more traditional PERT diagram used in Project Management in that they both contain a set of sequenced actions, one of their main distinctions is the TRT’s inclusion of Preconditions (assumptions about reality) paired with each action. This means that TRTs can contain numerous contingency plans that are triggered by the Preconditions that pertain at the time the plan is executed. Essentially, as execution of the plan proceeds, numerous different PERT charts can “fall out” of a TRT depending on what the “situation on the ground” looks like. This makes the TRT an ideal tool for creating plans that involve a significant degree of risk.
Flying Logic Setup
A TRT is based on Sufficient Cause Thinking, and this is how Flying Logic documents are set up when first created, so you do not need to do anything special with the Operators popup menus to start creating your TRT. TRTs often flow upwards, with the Goal at the top. So you may want to use the Orientation popup menu to change the orientation of your document to Bottom to Top.
.png)
TRTs are created using the entity classes in the built-in Effects-Based Planning domain, and primarily use the following classes: Goal, Precondition, Intermediate Effect, and Action. You can also use Desirable Effect entities to highlight other positive benefits of your plan, and Un-Desirable Effect entities if your sequence of actions causes unavoidable UDEs that further part of the execution plan must address.
.png)
Step 1: Identify the Goal
A TRT often contains a single Goal entity, but can contain more than one if they are reasonably related. You can start a TRT with an intuitive pre-conception of what your Goal should be, or you can start with your Goal taken from one of the injections taken from a Future Reality Tree, or an Objective taken from a Prerequisite Tree. In any case, the Goal entity should have as its title a clear, present-tense statement of the desired reality.
Step 2: Identify Intermediate Effects
If you have already done a Prerequisite Tree, you have a set of Milestone entities that you can copy directly into your Transition Tree document. It’s important to realize, however, that while the Milestones in a PRT are all necessary, they probably aren’t sufficient. The PRT is used for identifying and overcoming the things you don’t have yet, while the TRT is used for identifying everything you need to do, and the order in which you need to do them.
If you are not copying Milestone Entities from a PRT, you may want to create a number of Intermediate Effect entities that represent states you know will need to achieve along the way to your goal, and link them with edges to their order is more or less defined. It is not necessary to be absolutely rigorous at this stage; defining the exact causal sequence is the focus of the following steps.
.png)
Step 3: Define a Complete Step
A step of your execution plan requires three things:
- The outcome you want to achieve. This is either an Intermediate Effect, a Milestone copied from a PRT, or the Goal of your TRT.
- A statement of current reality. This is either a Precondition entity, which represents an aspect of reality that is out of your control an which must therefore be taken as a given, or an Intermediate Effect or Milestone that was the outcome of a previous step.
- An Action. To be well-defined, an Action must be something within your control or influence, with clear criteria for determining that it has been carried out successfully, and must be something that can be assigned to a resource with the responsibility and power to carry it out.
The current reality and action must logically combine as the necessary and sufficient causes of achieve the outcome.
.png)
If in reading your step, the action is not sufficient to produce the outcome, then it needs to be broken down into one or more sufficient sub-steps.
.png)
Step 4: Continue Building the Tree
Each of the intermediate effects in your TRT must similarly be characterized as complete steps: outcome of actions and current realities. Often these steps will form a linear sequence, but other times they will diverge into parallel sequences, or have more complex dependencies.
.png)
Step 5: Seek and Address Negative Branches
This is similar to the step of the same name in the description of the Future Reality Tree (FRT). In fact, a TRT can be thought of as a kind of FRT where instead of starting with an injection and ending up with the consequences, you start with a desired consequence (the Goal) and work backwards to the injections that will achieve it.
If you are working from a FRT you created previously, then your actions may already be designed to avoid the Un-Desirable Effects (UDEs) that are the hallmarks of negative branches.
On the other hand, sometimes it is impossible to avoid risk. Risk manifests as the failure of Preconditions (assumptions about reality) to be True when it comes time to execute the actions that depend on them. Depending on the nature of the environment in which the plan is executed, exactly which Preconditions may not hold true at the time the plan is executed can be very difficult to predict, and if you create a plan with a rigid picture of reality, you are likely to be disappointed when reality fails to conform. Thus, to the degree that your plan involves risks, it is critically important that you identify the UDEs that can result from the failure of Preconditions, and develop alternative courses of action that either mitigate those UDEs (the reactive approach) or avert them (the proactive approach.)
If a plan terminates with any un-addressed UDEs, it is incomplete.
.png)
A complete plan will terminate only with Goals or Desirable Effects.
.png)
.png)
Finally, what happens if all the conditions determined to be necessary and sufficient for a particular effect are present, but when the plan is executed the effect turns out to be absent? What if some other UDE we didn’t anticipate manifests? More importantly, how can we reduce the chances of this nightmare from occurring?
This is the case of unforeseen uncertainty (also called unknown-unknowns): things that have not been and could not have been imagined or anticipated. In this case there can be no pre-determined contingency plan, but there are some things we can do to prepare:
- If possible, try several approaches in parallel and ultimately commit to the one that works the best.
- Avoid hubris: nurture an organizational culture of humility and resist being blinded by your own expertise.
- Be flexible and willing to adapt the plan to a changing situation.
- Give heed to hunches and concerns of experienced stakeholders, even if those reservations are not (for the moment) clearly articulated.
For the last case, even inarticulate reservations can be added to a TRT as unspecified Preconditions, and removed later if they fail to materialize. Don’t add unknown-unknowns at every possible place, only where a strong, but unspecific reservation has been expressed. Unknown-unknowns can also be added as part of assessment when planned effects fail to materialize as a plan is executed.
.png)
Step 6: Read and Verify the Tree
This is similar to the step of the same name in the description of the Future Reality Tree (FRT). If you have included contingency plans, then step through the pertinent parts of your tree more than once, each time setting up your Preconditions to trigger the different paths through your tree.
Strategy & Tactics Tree
The latest addition to the TOC-TP application tools, the Strategy and Tactics Tree (S&T Tree) is used to move from the highest-level organizational goals to a comprehensive, multi-tiered, fully-justified set of implementation steps. It is used to implement a wide-ranging improvement throughout a larger organization by making it clear what role every part of the organization plays.
Flying Logic Setup
An S&T Tree is based on Necessary Condition Thinking. Since Flying logic documents are set up for Sufficient Cause thinking by default you will want to set the Operator popup menus as follows:
- Entity Operator: Fuzzy And (AND)
- Default Junctor Operator: Fuzzy Or (OR)
S&T Trees are usually read from top-to-bottom, starting at the highest-level Strategy. However, this means the flow of the edges (arrows) must be towards the highest-level Strategy or bottom-to-top: so you will want to set the Orientation popup menu to Bottom to Top.
.png)
S&T Trees are created using the entity classes in the provided domain file Strategy & Tactics Tree.logic-d you can open by selecting File ➡ Open Example... and then Domains/Strategy & Tactics Tree folder. When you open this you will offered the opportunity to either open it as a new, black Flying Logic document or import it into your currently open document.
.png)
Structure of the S&T Tree
The S&T Tree is based on the idea that Strategy and Tactics are complementary concepts used to describe a tree-like hierarchy of action, with each Step (node) of the tree justifying its existence with a strategy: a description of why the node exists. The highest-level strategy corresponds to the system’s goal.
.png)
Each Strategy is supported by a single Tactic entity that describes how the strategy will be implemented. The bottom of a complete S&T tree will always be a layer of Tactics: the most fundamental actions that support the strategies.
.png)
If more than one Tactic is necessary to implement a Strategy, a Tactic may be broken down into two or more sub-Tactics, but each one must first be justified by its own Strategy. Therefore, each Strategy always has exactly one Tactic below it, but tactics may have either zero, or two or more sub-Strategies.
.png)
If a Strategy has more than one possible Tactic that can accomplish it, then this can be added as an OR relationship.
For a given Strategy, we need to do more than provide a Tactic for accomplishing it, we also need to justify that Tactic as both necessary and sufficient to accomplish its parent strategy. So we create a Necessary entity and a Sufficient entity and make each one a sibling of each Tactic entity. The title given to each entity should do exactly as the class name suggests: describe why the Tactic must be implemented to accomplish the strategy (Necessary), along with why that Tactic absolutely will work (Sufficient). If there are numerous justifications for why a Tactic is Necessary or Sufficient, then additional Necessary or Sufficient entities can be added, or they can be enumerated in the entity’s textual annotations.
One more entity class, the Parallel (“parallel assumption”) class is used to proactively answer objections that neither directly address the Necessity or Sufficiency of the Tactic, such as:
- The Strategy already exists: no action need be taken to implement it.
- It is not possible to implement the Tactic.
Taken together, all five kinds of entities constitute a Step.
.png)
Since S&T Trees can grow quite large, it is useful to use Flying Logic’s grouping feature to manage the diagram. One approach is to group all a Strategy’s supporting entities and use a junctor to combine their edges with an AND junctor so only a single edge emerges from the group.
.png)
Groups can, in turn, be used to group entire Steps, including the Strategy entity, the Tactic entity, and the sub-group containing the Necessary, Sufficient, and Parallel (NSP) entities. Using this technique, you can arrange a very large S&T Tree to make it easy to “drill down” to the level of detail you need. Take these ideas as suggestions, and feel free to develop your own techniques for managing large Flying Logic diagrams.
.png)
Part III: Other Techniques
.png)
Evidence-Based Analysis
This category of entity classes is suited to an environment when a more probabilistic mode of analysis is desired. One real-world scenario where Evidence-Based Analysis is useful is in Competitor Analysis. Usually an analysis is designed and then carried out over a period of time. During such time, Propositions may be discovered to hold, which may trigger further actions by the agency conducting the analysis.
Flying Logic Setup
There are two styles of Evidence-Based Analysis: belief-network and probabilistic. If the belief-network style is used, the Flying Logic document is set up with Proportional (::) for both the entity operator and default junctor operator. If the probabilistic style is chosen, the document is typically set up with Sum Probabilities (⊕) as the entity operator and Product (×) as the default junctor operator. This setup is analogous to the use of Fuzzy Or (OR) and Fuzzy And (AND) in Sufficient Cause Thinking.
.png)
.png)
Proposition
Propositions (also known as requirements) are questions for which the analysis is intended to discover the most likely answers. Propositions take the form of a statement that has some probability of being true. Determining whether the probability of the Propositions exceeds determined thresholds is a primary purpose of Evidence-Based Analysis. Propositions are analogous to goals in Effects-Based Planning, and thus are terminal, i.e., they are always successors and never predecessors.
.png)
Indicator
Indicators are potential causes for Propositions or other Indicators, and can be considered analogous to Intermediate Effects in Effects-Based Planning. Another way of thinking of Indicators is as inferred evidence. Each Proposition typically has a set of Indicators that feed into it, each of which is considered to be a possible cause of the Proposition, and which together form a “template” for recognizing that the Proposition holds (i.e., that the requirement has been met.)
.png)
Each indicator in turn may have a set of more specific indicators which feed into it and form a “sub-template” for recognizing that the indicator in question probably holds. Indicators are usually both successors and predecessors.
.png)
In a complex analysis, individual analysts can be assigned responsibility for certain indicators, which places them in a supervisory role over all indicators that are predecessors of the indicators for which they are directly responsible.
Event
Events represent direct evidence which becomes known throughout the life cycle of the analysis. In the intelligence community for example, Events may be derived from Signals Intelligence (SIGINT), Human Intelligence (HUMINT), or Open Source Intelligence (OSINT).
Events are always predecessors and are never successors. They are assigned a Confidence value based on their reliability (or probability.)
.png)
Knowledge
Knowledge represents pertinent facts known to be true about the situation under analysis. Knowledge can be built into the analysis before events are received, or can be added to the analysis in response to events as they occur. Knowledge entities are combined with Events to provide context and semantics either supporting or refuting the various indicators into which they feed.
Like Events, Knowledge entities are predecessors and not successors. They are assigned Confidence values based on their reliability (or probability.)
Edge Weights
Edge weights in the model are assigned based on the positive (or negative) correlation between each entity and its successors.
.png)
Concept Maps
Concept Maps are used to visualize and capture or convey a quick understanding of a web of related concepts.
Flying Logic Setup
Concept Maps are created using the entity classes in the provided domain file Concept Map.logic-d in the Examples/Concept Maps folder. You can either import this domain into an existing document with the Entity ➡ Import Domain command, or open it with the File ➡ Open command, in which case it acts like a template document and opens a new, untitled document with the Concept Map domain already imported and ready for use.
.png)
Structure of Concept Maps
Concept maps use two entity classes, Concept (•) and Relation (→). Symbols were used for the entity class names instead of words because Concept Maps are read entirely from their entity titles, and the words “Concept” and “Relation” are never spoken.
Concepts Maps start with one or more main concepts at the root, and relations are used between concepts to connect in supporting concepts. The main rule when building Concepts Maps is that each Concept→Relation→Concept step should be readable as a complete sentence. Additional relevant concepts can be added in any order, and connected in as many places as they are used.
.png)