Graph Logic
Flying Logic provides tools for you to test and work with the logic of your diagrams.
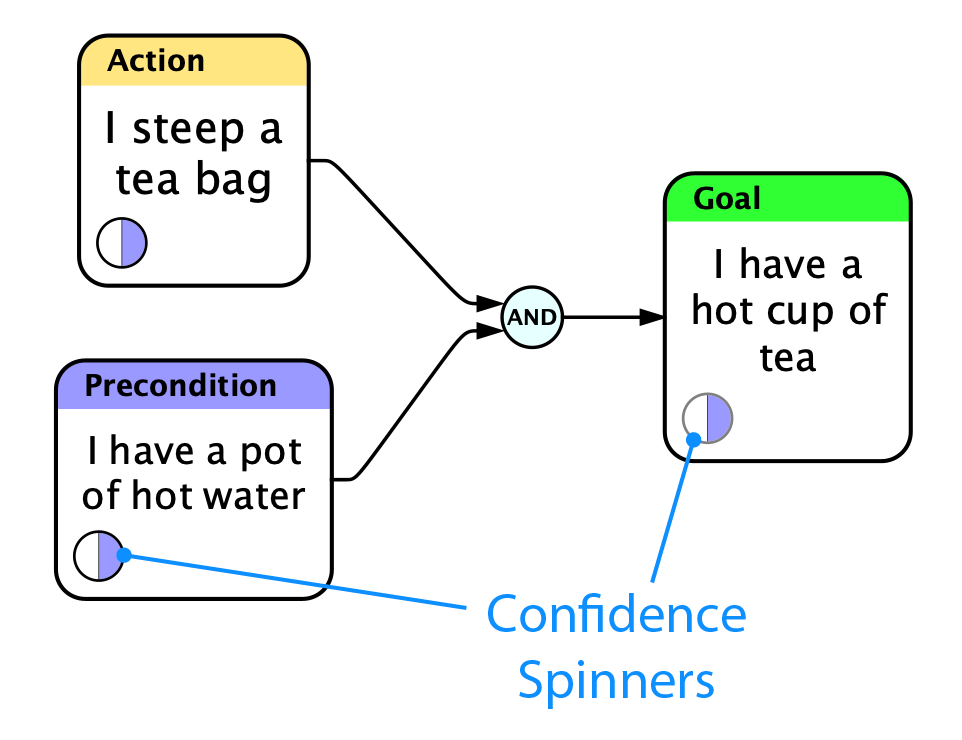
Confidence Spinners
By selecting the View ➡ Confidence command or clicking the Confidence toolbar icon, each entity reveals a small circle called a spinner. Confidence spinners represent a single numeric value that can be thought of as a percentage from 0% to 100% (0.0 to 1.0). You can use Flying Logic’s preferences to choose whether spinners are displayed with shading only (no symbol), a numeric value from 0 to 100, or a symbol, which for confidence spinners displays F (false) for 0%, T (true) for 100%, and shading only for other values. See Preferences.
Setting Confidence Values
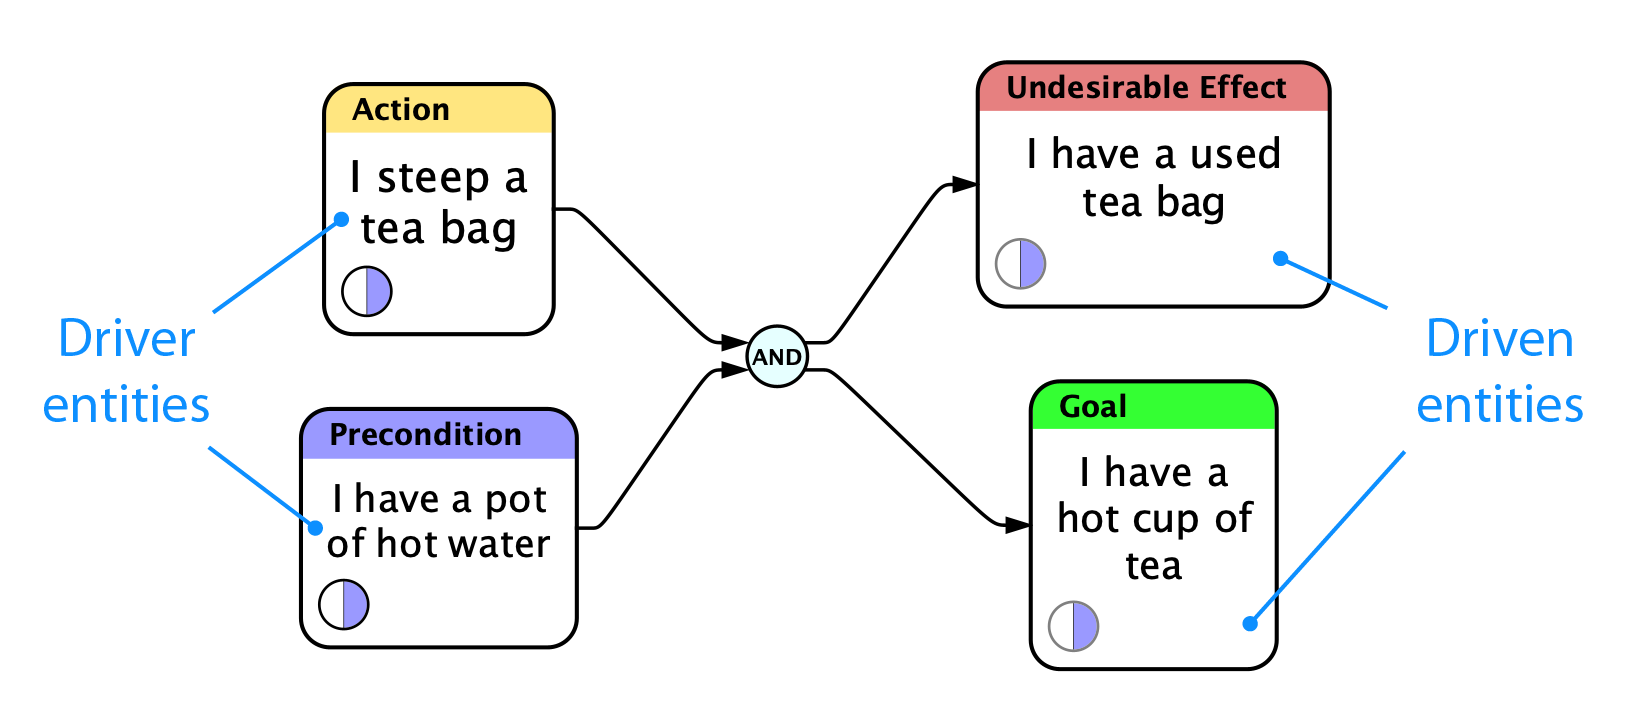
Entities that have no incoming edges are drivers, and the value of their confidence spinner can be changed directly by clicking and dragging on the spinner. Entities that have one or more incoming edges are driven, and their confidence value is purely the result of how their inputs are combined. Spinners of driven entities are bordered by a gray circle, and dragging on them has no effect. For drivers, you can drag right or up to increase the spinner’s value, and left or down to decrease it. As you drag, all driven entities affected by your changes are updated simultaneously.
You can also hold down the Shift key while dragging to constrain the spinner’s value to increments of 5%, and (while the mouse button is still down) use the arrow keys on your keyboard to “nudge” the spinner’s value up or down in 1% increments.
Finally, you can use keypresses to change the confidence values of all selected driver entities. Pressing the ‘1’ key through the ‘9’ key changes the confidence values from 10% to 90%, while pressing the ‘T’ key (for True) changes it to 100%, pressing the ‘F’ key (for False) or ‘0’ (zero) key changes it to 0%, and pressing the ‘U’ key (for Unknown) changes it to 50%.
The Meaning of “Confidence”
Confidence is simply a numeric value, but what it actually means is subject to the needs of your project and the operators you use to manipulate it. In the way Flying Logic documents are set up by default, the confidence value can be thought of as your level of confidence that the state of affairs described by a given entity holds. If the spinner is 0% shaded then you are expressing absolute certainty that the entity does not hold (logical False.) If the spinner is 100% shaded then you are expressing absolute certainty that the entity does hold (logical True.) If the spinner is 50% shaded, then you are expressing a logical Indeterminacy which could mean either no opinion or conflicting opinions about whether the entity holds.
There is a useful distinction between having no opinion and having conflicting opinions on a subject, although Flying Logic does not currently support modeling that distinction. In the case of having no opinion, you are asserting neither truth nor falsehood. In the case of having conflicting opinions, you are asserting both truth and falsehood. There are mathematically valid ways of representing such paraconsistent logic that Flying Logic may support in the future. For typical applications, it is usually most useful to think of confidence values of 50% as meaning no opinion.
Probability vs. Fuzziness
It is important to understand that in the way Flying Logic documents are set up by default, confidence values represent fuzzy boolean values, not probabilities. The basic distinction to remember is that probabilities deal with the uncertainty or likelihood of whether something may occur, while fuzzy logic (from which fuzzy booleans derive) deals with ambiguity or vagueness about what has, or has not, occurred. The following statement is probabilistic:
The water in the pot may get hot.
...While the following statement is fuzzy:
The water in the pot is hot enough.
Combining probabilities is done using multiplication, as in the case of determining the probability of two coin flips both coming up heads (50% × 50% = 25%). To combine fuzzy statements you use fuzzy AND, OR, and NOT operators, which correspond to mathematical minimization, maximization, and complement. (“hot water” AND “steep tea bag” SUFFICIENT FOR “hot tea”). So far we have seen examples of AND and OR. See Edge Weights for a discussion of fuzzy NOT. See Operators for a discussion of how to set up Flying Logic documents for probabilities.
Operators
Confidence values flow through the entities, edges, and junctors of a Flying Logic document, being modified along the way by the operators they encounter. This section discusses the operators found on entities and junctors— edges also perform a weighting function discussed in Edge Weights.
Numeric Data Types
Confidence values are represented as one of two data types: fuzzy boolean or floating-point. The primary difference between the two types is that fuzzy booleans are restricted to the range 0.0 to 1.0, while floating-point values are not. Some of the operators in this section are primarily for use when dealing with fuzzy booleans, some are primarily for dealing with floating-point values, and some work just as well with either. Generally, if the result of an operation is outside the range of a fuzzy boolean, it will automatically be converted to a floating-point value. Flying Logic displays different kinds of edge arrowheads depending on whether a fuzzy boolean or floating-point value is flowing through it.
For now, all numeric input and output in Flying Logic is handled by spinners, which can only handle the range 0.0 to 1.0 (for confidence values) or -1.0 to 1.0 (for edge weights.) It is expected that a future version of Flying Logic will incorporate more data types and additional methods for their input and output.
.png)
In the above example, the results of the Sum junctor are 1.25, and since this value is out of the fuzzy boolean range, the arrow leaving the Sum junctor has an open arrowhead, indicating a floating-point value. This value cannot be displayed by confidence spinners, and as a result the spinner of entity C turns red. However, the correct value is propagated, as seen from the results of the Product junctor displayed in entity E.
Basic Operators
The Basic Operators are sufficient for creating diagrams that support the TOC Thinking Processes.
| Fuzzy AND | AND | Returns the minimum of its inputs. Inputs are interpreted as “necessary conditions.” Output value is always fuzzy boolean. |
| Fuzzy OR | OR | Returns the maximum of its inputs. Inputs are interpreted as “sufficient causes.” Output value is always fuzzy boolean. |
Advanced Operators
The Advanced Operators are used to support modeling using probabilities and other advanced applications.
| Fuzzy Exclusive Or | XOR | For output to be true, exactly one input must be true. Inputs are interpreted as “sufficient but mutually exclusive causes.” Output value is always fuzzy boolean. |
| Proportion | ∷ | Treats each input as a “vote” of a strength proportional to the confidence value and the edge weight. Edge weights of zero count as abstentions and do not affect the output, which is different from a simple average where each zero input tends to reduce the output. Output value is fuzzy boolean unless at least one input is floating-point, in which case the output is floating-point. |
| Sum | + | Returns the sum of its inputs. Output value is fuzzy boolean unless at least one input is floating-point or the sum is outside the range of a fuzzy boolean, in which case the output is floating-point. |
| Sum Probabilities | ⊕ | Follows the Specific Addition Rule, also called the OR rule. Useful for calculating the probability of two or more independent events causing a particular outcome. For example, the probability of one OR both of two flipped coins coming up heads is 50% ⊕ 50% = 75%. Output value is fuzzy boolean unless at least one input is floating-point, in which case the output is floating-point. |
| Product | × | Returns the product of its inputs. Often used to determine the probabilities of two or more independent events occurring together (the Specific Multiplication Rule, also called the AND rule.) For example, the probability of a first AND second coin flip both coming up heads is 50% × 50% = 25%. Output value is fuzzy boolean unless at least one input is floating-point, in which case the output is floating-point. |
| Reciprocal | 1/n | Returns the reciprocal of its input. Output value is always floating-point. Often used to implement division by way of a / b = a (1 / b). If more than one input is present, returns the reciprocal of the sum of its inputs. |
| Negate | -n | Returns the negation of its input. Output value is always floating-point. If more than one input is present, returns the negation of the sum of its inputs. |
| Complement | 1-n | Returns the complement (1-n) of its input. Output value is fuzzy boolean unless at least one input is floating-point or the sum is outside the range of a fuzzy boolean, in which case the output is floating-point. |
| Minimum | MIN | Returns the minimum of its inputs. Output value is fuzzy boolean unless at least one input is floating-point, in which case the output is floating-point. |
| Maximum | MAX | Returns the maximum of its inputs. Output value is fuzzy boolean unless at least one input is floating-point, in which case the output is floating-point. |
| Average | AVG | Returns the average of its inputs. Output value is fuzzy boolean unless at least one input is floating-point, in which case the output is floating-point. |
| Distributor | ☼ | The distributor behaves exactly the same as the Sum (+) operator, but is intended as a convenience for situations where a single input value is to be distributed to several outputs in a location of the diagram far away from where the value was originally produced. |
Junctor Operators
The purpose of junctors is to combine several inputs into an output value using an operator. The name of the operator is displayed on the junctor itself, and is by default Fuzzy And (AND).
Each junctor in a diagram can use a different operator, and the operator that new junctors are created with is set using the Default Junctor Operator popup in the Operators Inspector.
To change the operator of an existing junctor, use one of the following options:
- Select the junctor, then select the desired operator from the Operator Popup in the Junctor Tab of the Element Inspector.
- Right-click (Mac, Windows, Linux) or Control-click (Mac) the junctor and select the desired operator from the popup menu.
Entity Operators
All entities in a diagram have an operator used to combine the confidence values from their incoming edges. By default this operator is Fuzzy Or (OR).
Unlike junctors which can each have a different operator, all entities in a given document have the same operator, which is set using the Entity Operator popup in the Operators Inspector.
Selecting a new Default Junctor Operator only affects junctors created after the change, but selecting a new Entity Operator immediately changes the operator used by all entities in the diagram.
Setting up for Probabilistic Analysis
Usually you will make selections from the Entity Operator and Default Junctor Operator popups in the Operators Inspector just once when you begin building a diagram. If you are building a diagram using a fuzzy methodology such as Effects-Based Planning, the entity operator Fuzzy Or (OR) and the default junctor operator Fuzzy And (AND) will usually be fine (these are the document defaults.) If you are using a probabilistic methodology such as Evidence-Based Analysis, a common setup is to have Sum Probabilities (⊕) as the entity operator and to have Product (×) as the default junctor operator. This setup is analogous to the use of OR and AND in the default (fuzzy) setup. In cases where you are evaluating a belief network and wish to use a more intuitive vote-like setup, you will usually set both the entity operator and default junctor operator to Proportion (∷).
Edge Weights
Just as each entity carries a confidence value, each edge carries a numerical edge weight value. When visible, each edge displays a spinner that indicates its weight.
Edge weights can be displayed for every edge in the diagram, or only for selected edge weights. To show weights for every edge, select the View ➡ Edge Weights command or click the Edge Weights toolbar icon. To display weights for only selected edges, select the edges you desire and then use one of the following options:
- Select the Edge Weight Visible checkbox in the Edge Tab of the Element Inspector.
- Right-click (Mac, Windows, Linux) or Control-click (Mac) any of them and select the Show Selected Edge Weights command from the contextual menu.
The setting for the View ➡ Edge Weights command overrides the settings for showing individual edge weights. When it is turned on, all edge weights will be visible and the individual settings for edges are ignored.
Edge weights can be thought of as percentages from –100% to 100%. Negative weights are represented as red, and positive weights are green. A weight of exactly zero is represented as yellow. The same preference that selects what kind of symbol to display inside of Confidence spinners also controls the symbol displayed inside edge weight spinners. Another preference lets you decide how the color of the edge itself corresponds to the edge weight. By default, edges with positive weights are black, edges with negative weights are red, and edges with zero weights are gray. See Preferences.
.png)
Edge Weights Displayed
In the belief network illustration above, the confidence values of the Knowledge entities represents the strength of belief in each statement, while the edge weights represent the correlation between the knowledge items and the propositions under consideration. The resulting values are combined using the Proportion (∷) operator.
Setting Edge Weight Values
Unlike confidence spinners, there is no “driver/driven” distinction with edge weights— every edge weight may be adjusted independently of all the others. Clicking and dragging on edge weight spinners works the same way as it does for confidence spinners, as does holding down the Shift key to constrain changes to increments of 5%.
You can also use keypresses to change the edge weight values of all selected edges. Pressing the 1 key through the 9 key changes the weight values from 10% to 90%, while pressing the – (minus) key changes it to –100% (logical negation or negative correlation), pressing the + key changes it to 100% (positive correlation), and pressing the 0 (zero) key changes it to 0% (no correlation).
The Edge-Weighting Function
The edge-weighting function is illustrated below. For floating-point values, the result is a simple multiplication. For fuzzy boolean values, the calculation is slightly different. In the case of a simple multiplication, a 100% confidence value (True) multiplied by a 0% edge weight would yield a 0% result (False). What should happen is that a true assertion given no weight should yield an Indeterminate result (neither True nor False). To accomplish this, Flying Logic temporarily converts fuzzy boolean values into the range -100%...100% (like edge weights) multiplies the two values, and then converts the results back into the fuzzy boolean range 0%...100%, which yields the desired result.
.png)
Logical Negation
Edge weights are often used in the probabilistic context of Evidence-Based Analysis. But they are also useful in Effects-Based Planning to represent fuzzy NOT (logical negation.) Even without revealing the edge weight spinners, you can right-click (Mac, Windows, Linux) or Control-click (Mac) an edge and select a positive (+), neutral (0) or negative (–) edge weight from the popup menu that appears. For fuzzy boolean values, negative edge weights represent the logical negation of the input. For more information about Effects-Based Planning and Evidence-Based Analysis, see Thinking with Flying Logic.
.png)