Chart View
The diagrams created in Flying Logic can be displayed in a second way called Chart View. This view is activated for a document by selecting the View ➡ Switch to Chart View command, which changes to Switch to Graph View when Chart View is active. In this mode each entity, junctor, and group is shown as one row of a chart. The top-most row displays the entity or group that would appear at the top of a Top-to-Bottom layout in Graph View, while the bottom-most row displays the entity or group that would appear at the bottom.
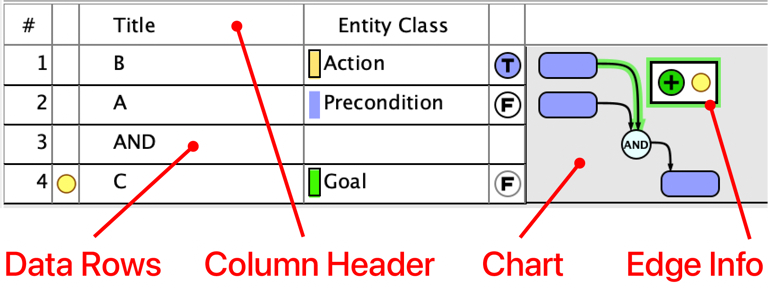
Each row is divided into two parts. On the left are a series of columns containing information about the element in that row. On the right is the actual display of that element, similar to Graph View.
The set of columns to be shown can be modified based on both document-wide settings (like Confidence), while others can be selected by using the context menu for the column header row (like Entity Class). The width of the entity title and class columns can be changed by dragging the separator line at the right of the column in the Chart View header.
The elements in the diagram can be manipulated in Chart view just like in Graph view, including selecting, reconnecting, and moving elements between groups. Inline editing of entity titles can be activated by double-clicking on an entity, and all context menus are available.
As the result of the density of edges in the diagram in Chart view, only one selected edge has its weight and annotation shown at a time. These appear in an Edge Info box that floats next to the edge. The weight can be manipulated just as in graph view, and a tooltip will appear when the mouse cursor is over the annotation icon. The box does not appear if the edge has no visible weight or annotation.
Additional columns and diagram features appear when Project Management is enabled. See Project Management.